BPAC comments on 5th Street and West Main
2026-08-08 → 2026-08-16
These are follow-up comments from the August 6, 2026 BPAC meeting. The quotations are my notes from the discussion, not an official transcript.
Update (2026-08-16): city staff responded in writing; my summary and follow-ups are in Staff response on 5th Street and West Main.
West Main is a once-in-a-generation opportunity#
West Main connects UVA and Downtown, two of Charlottesville’s main activity centers. The city calls the West Main/Ridge intersection a primary gateway between UVA and the Downtown Mall. The Free Trolley already links the two destinations and is CAT’s most popular route among UVA students. This is exactly the kind of short urban corridor where safe biking and frequent, reliable transit can replace car trips.
The timing makes this a rare opportunity. The city has begun a multi-year replacement of gas and water mains along University Avenue, West Main, and side streets. We should decide what transportation system we want before utility reconstruction and piecemeal projects lock the old street back into place.
The construction will disrupt existing travel habits regardless. That nuisance is also an opportunity: when routines are already changing, the rebuilt street will shape which choices become convenient afterward. Coordinating the utility work with safe biking and transit priority could establish new habits; restoring the old geometry would reinforce the old ones.
A transit- and bike-oriented West Main could move many times more people within the same width. NACTO’s peak-capacity comparison estimates 600–1,600 people per hour for a motor-vehicle lane, 7,500 for a two-way bikeway, and 10,000–25,000 for a transitway. For an equal-width, two-lane illustration, those figures yield a theoretical 17,500–32,500 people per hour for a bikeway plus transitway, compared with 1,200–3,200 for two motor-vehicle lanes: roughly 5–27 times as many people. These are capacity estimates, not ridership forecasts. West Main would approach them only with a connected, protected bikeway and transit that is frequent, reliable, and not stuck behind private vehicles.
The city should not assume that every current car trip must remain on West Main. It should ask which trips need a West Main destination, which can shift to biking or transit, and which through-trips can use US 250 or another route. Across dozens of road-space reallocation projects, some traffic has repeatedly evaporated: people change route, departure time, destination, or mode rather than all the displaced cars reappearing on nearby streets. The exact shift should be modeled, not promised, but it should not be ruled out by assumption.
This is also an economic-development choice. The research I previously summarized for West Main generally finds positive or neutral effects of bike and pedestrian improvements on nearby retail and food-service businesses. A safer, higher-capacity corridor can improve access to businesses without requiring more street width.
The city is also using traffic modeling to study West Main. Before those results steer the corridor’s future, staff should disclose which traveler responses the model allows, what bike, pedestrian, and transit data calibrate it, and which alternatives it compares. The same questions apply to the 5th Street projection.
The 5th Street traffic projection#
How does the model treat demand?#
Any traffic analysis should disclose which traveler responses it allows. FHWA identifies five common responses to changed road conditions: people can change route, departure time, destination, mode, or whether they make the trip at all. A model that holds motor-vehicle demand fixed cannot show those responses; it can only move the assumed cars around the network.
I do not know whether the 5th Street model holds demand fixed. That is why staff should disclose how demand is treated. If the model treats future car growth as unavoidable and uses that growth to justify preserving motor-vehicle capacity, the forecast can become self-fulfilling: easier driving induces more driving. The city should compare that scenario with one in which a connected, protected bikeway shifts some trips out of cars and increases total person-throughput.
Compare forecasts with observed outcomes#
Past projections show why this distinction matters:
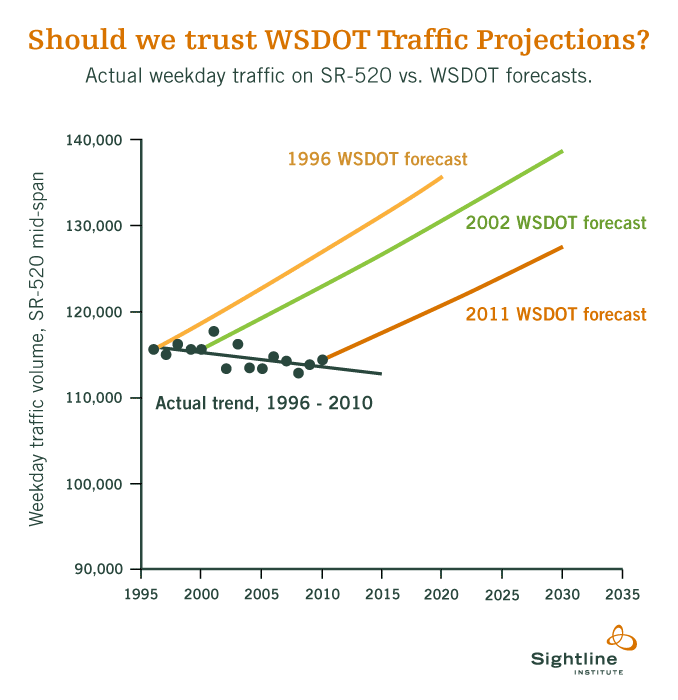
Forecasts of gridlock after road-space reallocation have often been too pessimistic. A review of more than 70 cases in 11 countries found an average 21.9% reduction in traffic on the treated road or within the study area; the median reduction was 10.6%. Some traffic diverted, but not all of it reappeared nearby: people also changed when, where, how, or whether they traveled. This is Traffic evaporation.
Seoul’s Cheonggyecheon restoration is a useful example. The city removed a 5.8-kilometer elevated highway and four of eight surface lanes. Post-project monitoring reported by the OECD found that most of the former corridor traffic did not reappear on nearby streets or elsewhere in the urban area. Travelers shifted departure times, Metro use increased, and road trips declined.
These cases do not prove that the 5th Street projection is wrong. They establish why staff should disclose whether the model allows comparable behavior changes and how the method has performed when validated against completed road-space reallocations.
What data calibrate the model?#
A good back-test would not by itself validate the model for this decision. If the 5th Street model is calibrated mainly on historical US travel data, that record reflects decades of car-oriented development, including Induced demand and suburbanization. It may reproduce a future that repeats the past while saying little about the scenario this project is supposed to evaluate: a street whose design and mode options change. Staff should disclose the calibration period, input data, validation tests, and sensitivity analyses.
Mode-shift projections are only as good as the mode data behind them. Most US jurisdictions count motor vehicles routinely but collect much less comparable data on biking and walking. A model without those data has little local evidence with which to calibrate or validate mode choice. Joe Cortright calls this the “drunk under the streetlamp” problem: abundant car data make car projections look rigorous while changes in other modes remain poorly measured. If you don’t count it, it doesn’t count.
This matters directly for 5th Street because the case for a protected bikeway rests partly on mode shift. If the city has bike and pedestrian counts for the corridor, it should publish them alongside the car counts. If it does not, staff should say so and explain how the mode-choice component was calibrated.
The 5th Street design#
What kind of street is 5th Street supposed to be?#
The city should first clarify whether 5th Street will remain a high-speed motor-vehicle corridor or become a safe urban street. The bikeway design should follow from that decision.
If 5th Street will remain high-speed, people biking need mode separation: either a completely different corridor or continuous physical separation from motor traffic, including at intersections. A bike lane painted along the side of a fast road does not create a low-stress route, even with flexi-posts. If 5th Street will become a safe street, its physical geometry and perceptual cues should make low speeds feel natural through narrow lanes, tight corners, compact crossings, and protected intersections. Signs and hoped-for congestion are not substitutes for a self-enforcing design.
The current approach risks an incoherent hybrid: a street that does little to slow motor vehicles, with a nominal bike lane attached to its edge. That would give people biking neither meaningful separation nor a genuinely slow street.
I do not think adding a bike lane is automatically an improvement. A facility that people do not feel safe using will attract few riders, especially among the “interested but concerned” group that a useful network must serve. A national survey of 3,000 adults in the 50 largest US metropolitan areas placed about half of adults in this group. Low use of an uncomfortable facility can then become a political argument against future projects: “No one uses the bike lanes.” The evaluation ends up measuring a design failure and calling it weak demand. Counting an unusable lane as completed infrastructure makes that mistake more likely. See Anti bike lanes.
Measure people, not only vehicle delay#
Motor-vehicle level of service and person-throughput answer different questions. Level of service grades vehicle delay; it does not tell us how many people a street moves or whether they can travel safely. Gary Toth argues that level of service and travel projections are highway-era tools often misapplied to city streets. The city should report person-throughput and safety outcomes alongside vehicle delay.
NACTO’s peak-capacity comparison estimates 7,500 people per hour for a two-way bikeway, compared with 600–1,600 for a motor-vehicle lane. Even against the high end of the motor-vehicle estimate, the bikeway has nearly five times the theoretical person-capacity.
That capacity is not a ridership forecast. It matters only if the bikeway is connected, useful, and comfortable enough to attract riders. A bad bike lane is the worst of both worlds: it reallocates street space without giving enough people a practical alternative to driving. A connected, protected bikeway can move far more people in the same space and reduce the number of cars competing for the remaining lanes.
“There will be enough traffic, so the speed will be low”#
Congestion is not Traffic calming. It is not sensible to assume that a road will be congested 24/7. Congestion slows drivers only while a queue exists. The intersection must remain safe at midday, at night, and whenever the queue disappears. NACTO says street design must account for every hour of the day, not depend on peak traffic to regulate speed. If the street is safe only when another driver blocks the way, the geometry still permits the dangerous speed.
A bike lane between motor-vehicle lanes creates a mandatory conflict#
Safe street design starts by eliminating conflict points, especially between vulnerable road users and motor vehicles. A through bike lane between a through lane and a right-turn lane creates a mandatory weaving conflict. Every right-turning driver must cross the bike lane, while cyclists travel between moving or queued vehicles. NACTO advises against placing bike traffic between motor-vehicle lanes because the merge raises crash risk and can put cyclists in drivers’ blind spots.
This is the geometry of a right-hook crash: a driver begins to the cyclist’s left, moves right across the cyclist’s path, and may not see the cyclist in the passenger-side blind spot. FHWA’s Bicycle Road Safety Audit Guidelines found that motorists turning or merging into a cyclist’s path were the most frequent group of parallel-path crashes in the studies it reviewed. The guidelines specifically warn that right-turning drivers may not see cyclists approaching in their blind spot. The proposed geometry deliberately places riders in that known conflict pattern.
The problem is captured, darkly, by this meme:

Charlottesville’s project page reports that the Cleveland Avenue turn lane serves 16 vehicles in the morning peak hour and 37 in the afternoon peak. Even at the busier peak, that is less than one turn every two minutes. Removing the dedicated lane would keep the bikeway curbside and require drivers to slow in the through lane before turning. If the turn lane remains, the crossing should be separated by protected geometry or a distinct signal phase.
Fire-engine and school-bus turning radius#
The right question is whether an actual school bus and Charlottesville’s current fire engine can complete a slow turn safely, not whether the largest legacy vehicle can remain entirely within one lane at passenger-car speed.
This is a tradeoff. Requiring a school bus or occasional fire engine to turn more slowly may cost a few seconds. A wide corner lets every driver turn faster every day and lengthens the crossing for people walking. The city should compare those costs explicitly rather than give large-vehicle speed absolute priority.
Charlottesville’s own design manual, p. 47 warns that designing for the largest possible vehicle can encourage faster turns and longer pedestrian crossings. It recommends 15–20-foot physical corner radii with a 28-foot effective path supplied by mountable truck aprons, and it permits a school bus to encroach minimally into the opposing lane. What physical and effective radii does the 5th Street design propose? Which vehicles and turning assumptions produced them?
Charlottesville has already chosen newer, smaller fire engines in part because they are easier to maneuver on city streets. The intersection should be designed for the current fleet and the direction the city has chosen, not locked into wide geometry around the largest legacy vehicle.
The safety effect is measurable. An FHWA study estimated 30% more pedestrian crashes at a 30-foot Corner radius than at 10 feet, holding other modeled factors constant, and 59% more at 70 feet. These are general estimates rather than a prediction for this intersection; staff should provide the proposed radii so we can calculate the relevant comparison.
Daylighting is not about signs#
Daylighting means physically clearing the sightline near a crossing. A parking sign may announce the restriction, but it cannot substitute for the cleared space. The design should keep vehicles out of the sight triangle with a curb extension, delineators, or another self-enforcing treatment. NACTO recommends removing parking within 20–25 feet of an intersection.
Daylighting is also one of the cheapest and simplest intersection-safety treatments (cost evidence). What prevents the city from amending its engineering standard now to require physical daylighting at every eligible intersection whenever repaving, utility work, or other road work occurs?
Priority questions for staff#
- Is 5th Street intended to remain a high-speed motor corridor or become a safe, low-speed city street? What target speed and physical design follow from that choice, and what protects people biking when congestion is absent?
- How does the traffic model treat demand? Does it allow changes in route, departure time, destination, mode, and whether people make a trip? Forecasts of road-space reallocation have often overpredicted traffic problems because not all displaced traffic reappears. Will staff publish the model, assumptions, calibration and validation, scenarios, sensitivity analyses, and outputs in enough detail for BPAC to evaluate its conclusions?
- Why does the proposed design place the bikeway between through and right-turning motor vehicles, a configuration NACTO advises against? What physical and effective corner radii are proposed, which design vehicles and turning assumptions produced them, and does the swept-path analysis use Charlottesville’s current front-line fire engine? How were the pedestrian-safety effects of larger corner radii considered?
- How is the West Main utility replacement being coordinated with the corridor’s long-term transportation design?
- What specifically prevents the city from revising its engineering standard now to require physical daylighting at every eligible intersection when repaving, utility work, or other road work occurs?