Traffic projection
2025-09-26 → 2026-09-17
Traffic demand is not weather. While a rain forecast does not make it rain, a traffic projection can dictate a road’s design, thereby realizing the traffic it predicted. But even this self-fulfilling prophecy mechanism, traffic projection often fails dramatically.
A projection describes what may happen under one particular land-use, transportation, and behavioral scenario, and that scenario depends on the choice we make regarding traffic engineering. Treating future car trips as a fixed input makes road expansion look necessary and reallocating road space look impossible. The model then hides a policy choice as a neutral forecast.
Traffic demand responds to street design#
FHWA identifies five common responses to changed travel conditions: people can change route, departure time, destination, mode, or whether they make the trip at all. Different tools represent these responses with different levels of success. A forecast should disclose which responses it models and test how its conclusions change when motor-vehicle demand is not fixed.
This works in both directions. Added capacity can create Induced demand, creating a self-fulfilling prophecy; reduced capacity can produce Traffic evaporation, against the excessively pessimistic projection. A model that omits these responses does not forecast an inevitable future. It tests a scenario in which people do not respond.
The numerous failures of traffic projection#
Traffic forecasts have been especially inaccurate when they assume that most cars displaced by a project must reappear on another street. A review of more than 70 road-space reallocation cases in 11 countries found that predictions of severe traffic problems were often unnecessarily alarmist. On average, 21.9% of the vehicles previously using the treated road or area could not be found anywhere in the surrounding area afterward; the median was 10.6%, the measure the authors prefer given the wide variation across cases. Either way, the traffic did not merely divert to nearby streets; it evaporated.
Denny Way bus lane, Seattle#
Seattle’s 2025 Route 8 corridor study modeled converting an eastbound general-purpose lane on Denny Way to a Business Access and Transit (BAT) lane. Its PM-peak simulation nearly doubled eastbound car travel time, from 16:38 to 34:36, and increased the number of vehicles unable to enter the modeled corridor from 852 to 1,381 per hour. The report called the resulting congestion “severe.” The comparison counted those 529 additional unserved vehicles as a cost, while a footnote says that SimTraffic could not measure transit travel times.
Seattle nevertheless installed a related but materially different design in August 2026, combining the bus lane with turn restrictions and a new route to southbound I-5. The city had already tested the key I-5 reroute during a construction closure: the same number of drivers reached the ramp during peak hours while eastbound Denny Way travel times improved by up to 15%. When the permanent lane opened, a Route 8 rider posted a rush-hour photograph and asked, “Where is the Carmageddon they promised?” The opening is a vivid challenge to the model, but not yet a completed before-and-after evaluation—and the built project is not identical to the modeled scenario.
I-5 Rose Quarter closure, Portland#
Before a five-week closure of all southbound I-5 lanes between I-405 and I-84 in September 2026, officials warned that commute times could reach two to three times their usual length and that congestion could back up into Washington. Yet OPB reported that traffic crossed the Interstate Bridge at its usual pace during the first rush hour, with only slightly heavier traffic on I-205. C-TRAN had added extra buses connecting Vancouver with light rail, and WSDOT credited advance warnings with giving travelers time to change their plans. This first Monday is evidence of adaptation, not a verdict on the full closure; WSDOT cautioned that traffic could increase later in the week.
Alaskan Way Viaduct closure, Seattle#
Seattle ran an even larger real-world test in 2019. Before the Alaskan Way Viaduct closed for three weeks, Sound Transit warned that up to 90,000 daily vehicles could shift to downtown surface streets, causing major congestion and delays. Instead, SDOT’s after-action data showed fewer vehicles entering downtown on every day of the closure than in its September 2018 baseline. Link light rail ridership rose 14% over the previous year, the city’s four counters recorded 40,000 more bicycle trips in January than in January 2018, and alternative work arrangements among city employees rose from 12.5% to 30%.
The threatened “Seattle Squeeze” did not simply divert 90,000 fixed trips onto the next street. People changed mode, time, route, and whether they traveled at all—the exact responses a fixed-demand model excludes. The warnings, temporary bus lanes, added transit options, and employer programs helped cause that adaptation, so the episode is both a forecast miss and a successful demand-management intervention.
Cheonggyecheon, Seoul#
Seoul provides a striking example. The city removed the elevated highway above Cheonggyecheon and half of the adjacent surface-road lanes. OECD’s review of before-and-after monitoring found that most of the former traffic did not reappear on adjacent streets or elsewhere in the urban area. The principal responses were shifted departure times and a significant increase in Metro use.
Road-expansion forecasts can become self-fulfilling#
Forecasts used to justify road expansion can create the outcome they predict. The model projects more driving; the city adds capacity; easier driving attracts more and longer trips and influences where people live and build; the resulting traffic is then cited as proof that the forecast was right.
This feedback is well established. Gilles Duranton and Matthew Turner found that vehicle-kilometers traveled rose roughly in proportion to interstate lane-kilometers across U.S. cities. They identified more driving by existing residents, increased commercial traffic, and population change among the sources. Erick Guerra argues that the expansion does not even deliver its promised economic payoff: the poorest US metros tend to have the most roadway per capita, and more roadway per capita correlates with lower, not higher, GDP per capita.
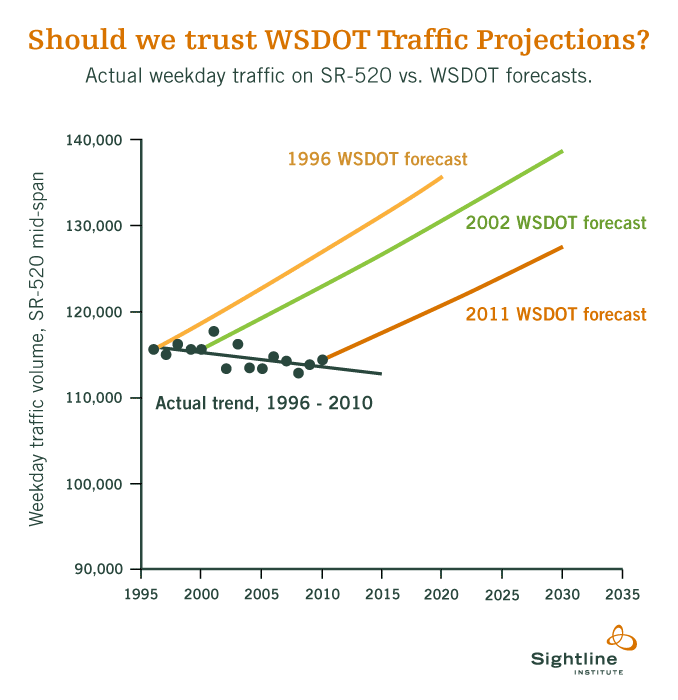
Forecasts also keep overpredicting growth even as reality diverges. Sightline’s comparison of WSDOT forecasts for Seattle’s SR-520 bridge shows successive projections (1996, 2002, and the 2011 Final EIS) each predicting substantial traffic growth while observed volumes stayed flat or declined for more than a decade.
This creates an asymmetry. Fixed-demand models can overstate disruption when road space is reassigned because they underestimate mode switching and other adaptation. The same projections can appear accurate when used to justify widening because the project induces some of the demand. That is not a neutral prediction; it is a self-fulfilling policy choice.
Car bias baked into the models#
Calibrated to a car-centric past#
Someone will say the model is trustworthy because it back-tests well: it reproduces the traffic we actually observed. But in the US, the historical record it is tuned to reproduce is decades of extremely car-centric development, with induced demand and suburbanization built in. A model calibrated on that history encodes car-oriented growth as the normal course of events and projects it forward by construction. Back-testing against a car-dominated past validates the model only for futures that repeat that past; it says nothing about the model’s accuracy in exactly the scenario the projection is supposed to evaluate, where the street design changes.
The data gap compounds the bias#
Most places in the US count motor vehicles routinely but collect little or no data on biking, walking, or other modes. A model cannot be calibrated or validated for mode shifts it has never observed, so its mode-switch predictions are a shot in the dark. The abundance of car data and the absence of everything else also produce asymmetric confidence: car projections look rigorous, while shifts to other modes are dismissed as speculative. That is Motonormativity baked into the data itself.
Joe Cortright calls this the “drunk under the streetlamp” problem: we search where the light is, not where the keys are. Agencies maintain traffic counts, speed studies, parking standards, and level-of-service metrics for cars, with no comparable vocabulary or statistics for walking or biking, so the hardships of those modes stay invisible to data-driven planning. If you don’t count it, it doesn’t count.
What to do instead#
Measure people, not vehicles#
Traffic studies often treat vehicle throughput as total transportation capacity, graded by “level of service”—a measure of vehicle delay. Gary Toth argues that level of service and travel projections are highway-era tools misapplied to city streets: projections routinely overestimate future volumes, and a street sized for its peak hour is overdesigned for the other 23, which invites speeding. The relevant measure is person-throughput. NACTO’s same-width comparison estimates 600–1,600 people per hour for a motor-vehicle lane, 7,500 for a two-way bikeway, and 10,000–25,000 for a transitway.
A design that moves fewer cars, ironically, can therefore move more people. But the theoretical capacity appears only when the bikeway is safe and connected and transit is frequent, reliable, and not trapped in car traffic. A nominal bike lane that few people feel safe using should not be counted as meaningful capacity.
What a credible analysis should disclose#
Before a traffic projection carries policy weight, the public should be able to reproduce and challenge it. Two requirements cover most of it:
- Auditable: the model files, observed inputs (traffic counts and their dates), and outputs in their native electronic formats, with calibration and validation against observed conditions.
- Explicit assumptions: the land-use and growth assumptions, which behavioral responses are modeled (mode choice, departure time, foregone trips), every scenario tested including road-space reallocation, and sensitivity tests showing which assumptions drive the conclusion.
A polished output is not enough. Without the inputs, behavioral assumptions, validation, and alternatives, the public cannot tell whether a forecast is evidence or simply the selected future encoded in a model.
Local cases#
Rose Hill Drive: You get the traffic you design for applies this critique to a Charlottesville project that projected roughly 1% annual vehicle growth without documenting its methodology on the public project page.
Charlottesville’s 5th Street SW Road Diet project page does the same: it presents modeled queue predictions out to 2046 (including a claim that queues at 5th Street Station would grow by about 70 feet) without documenting the model’s software, assumptions, inputs, or validation. The same project’s intersection design is discussed in Bike lanes at intersections.
Further reading#
- Denial and declining traffic on the I-5 bridges
- Engineering Bad Outcomes (with CityNerd) (The Urbanist Agenda podcast)
- All Traffic Models Are Wrong (Strong Towns)
- The Traffic Model Deceit (Strong Towns)