Rose Hill Drive: You get the traffic you design for
2026-04-12
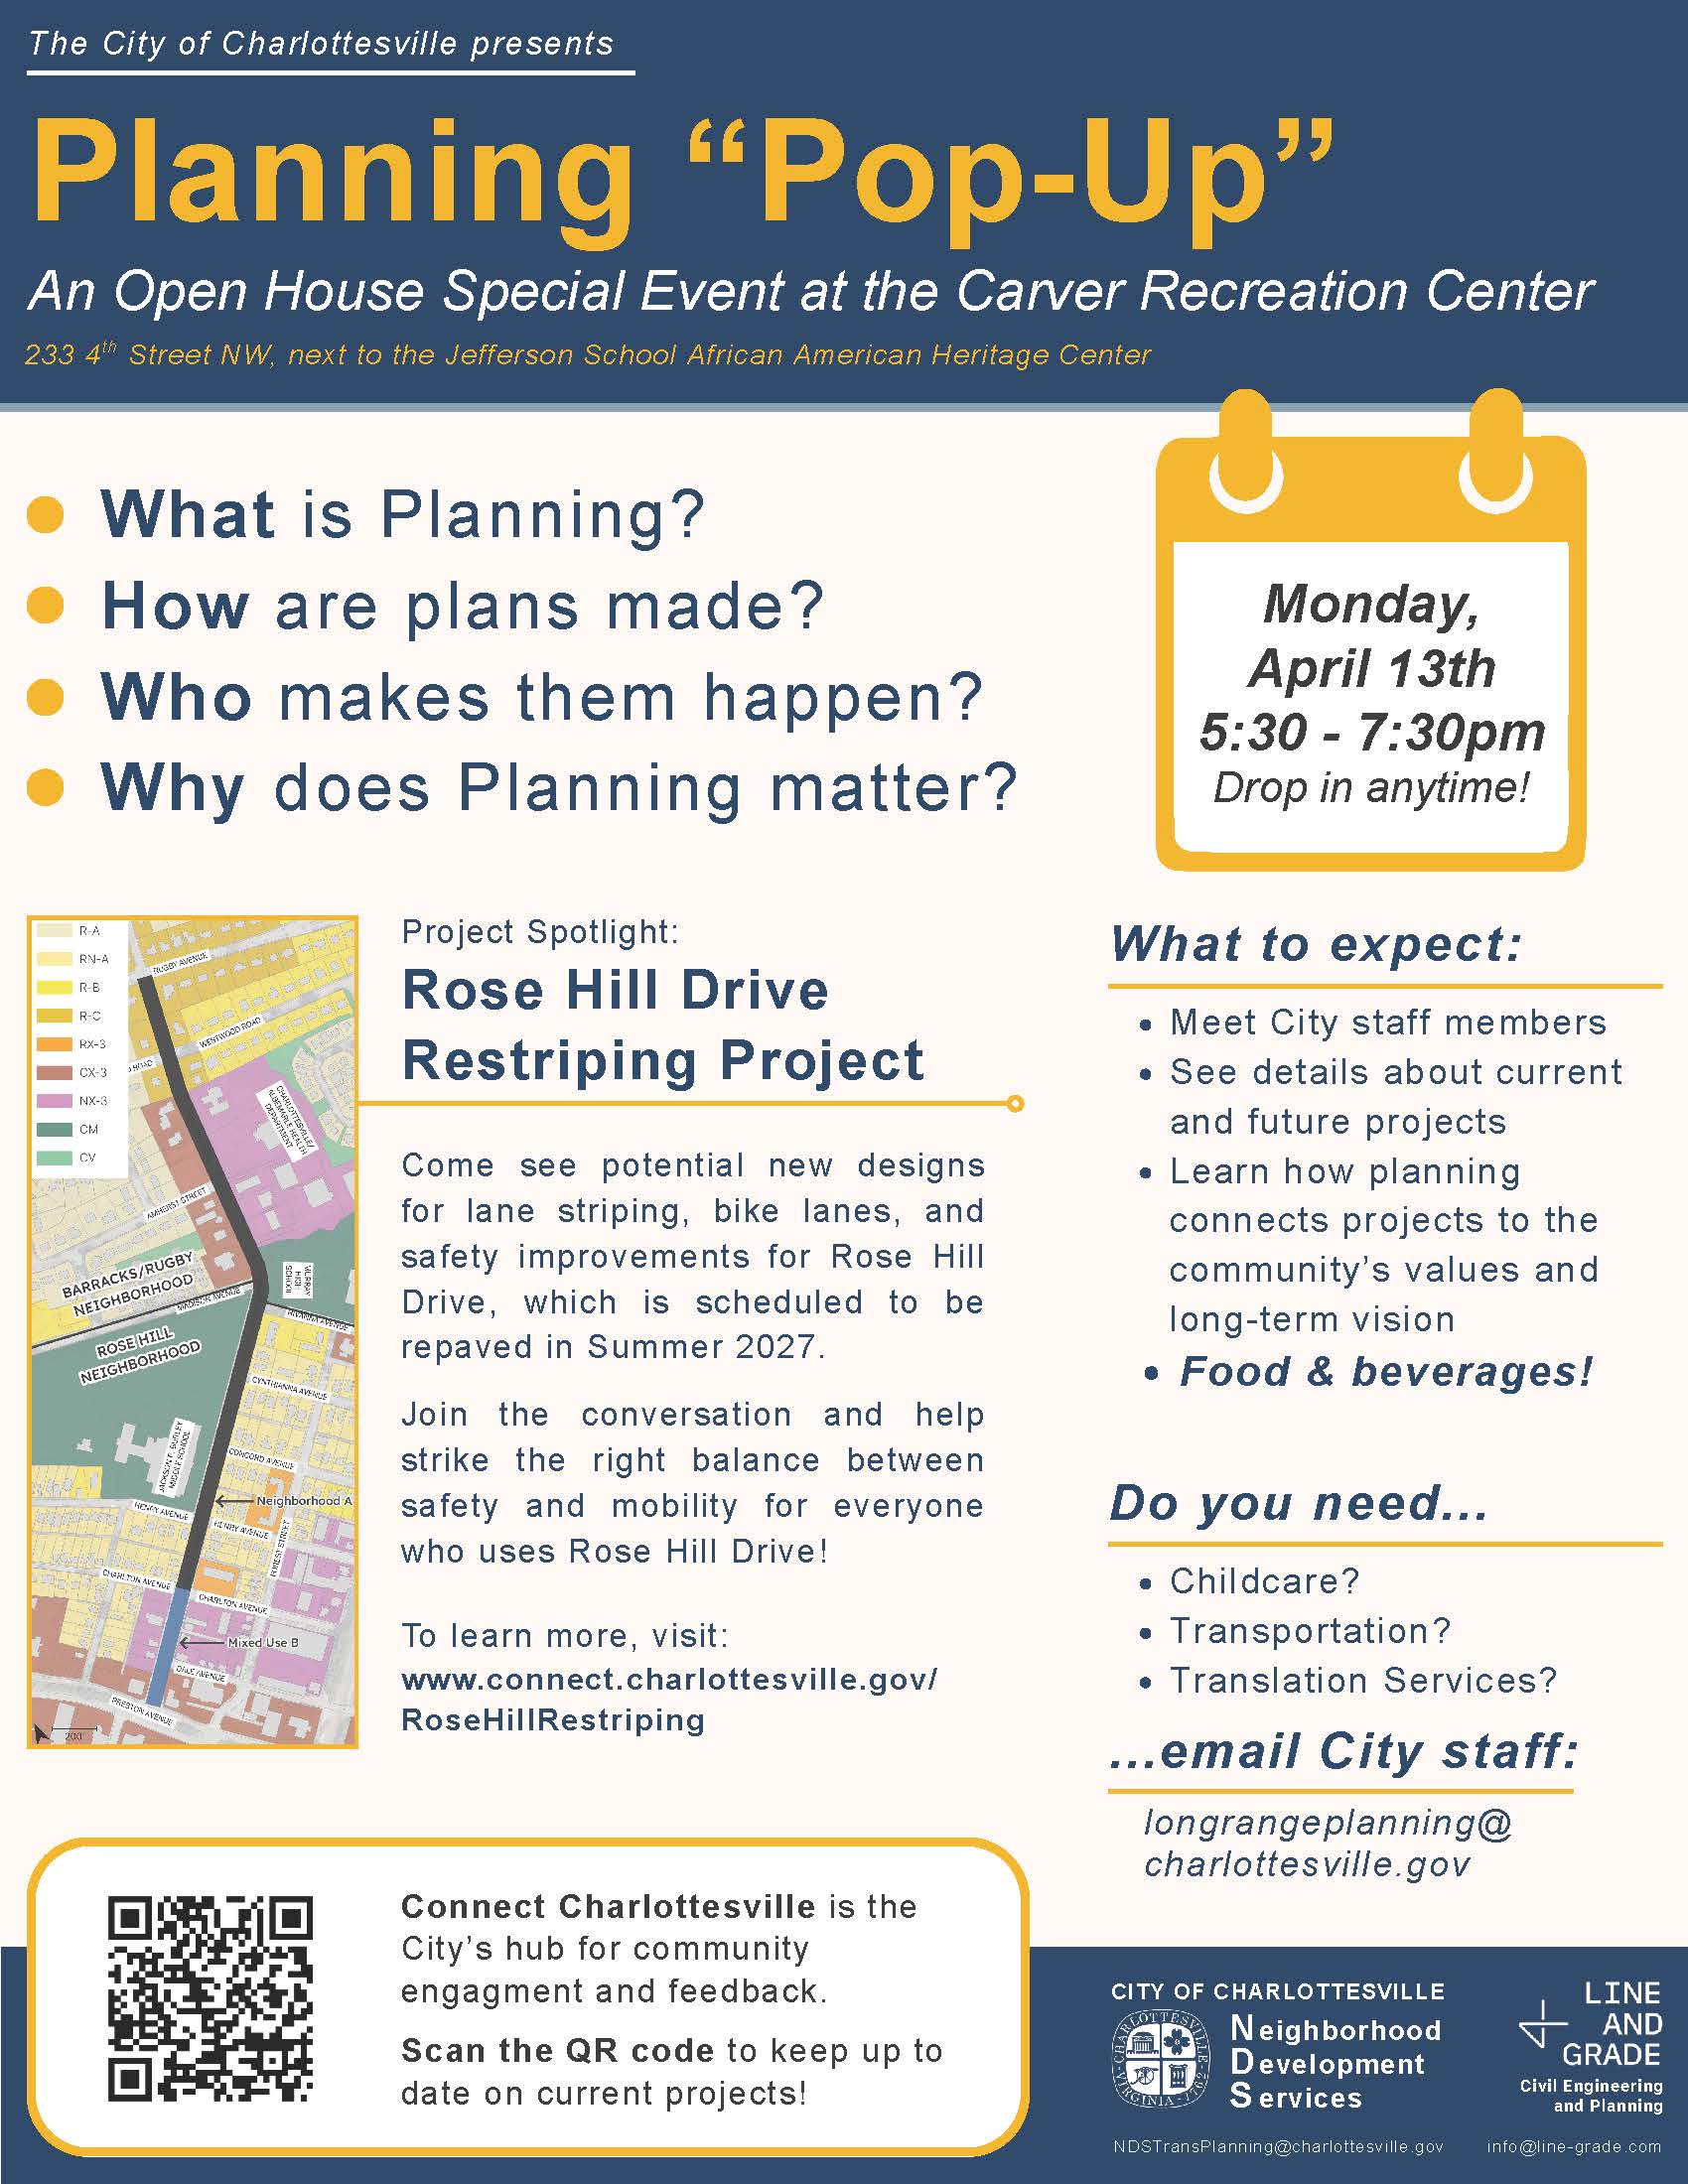
Rose Hill Drive is one of the key north-south corridors in Charlottesville, running between Preston Avenue and Rugby Road/Barracks Road. It sits between UVA and downtown, and provides access to Charlottesville High School, the YMCA, and the city center. How this road is designed matters for a lot of people.
The city is studying improvements ahead of a 2027 repaving. Here’s the project page with traffic data, crash history, and a timeline for community input—the next open house is tomorrow (April 13) at the Carver Rec Center from 5:30–7:30pm!
Looking at the project materials, many people noticed two concerns that I think deserve attention.
“Safety” vs. “volume” is a false choice#
The page frames safety improvements and traffic volume as two separate considerations to balance. But they don’t have to be, and in fact they can go hand in hand.
This framing quietly assumes that “traffic volume” means “how many cars can move through”—a textbook case of motonormativity, the invisible bias that treats car traffic as the default and only kind of traffic that counts.
When we consider “traffic volume” we need to think about the number of people, not the number of cars! Personal vehicles are just one of the transportation options. A person on a bike takes a fraction of the space of a person in a car. A bus carries 40 people in the footprint of a few SUVs. Sidewalks and light-rails are supremely more space efficient and carry 10 times or more people if we dedicate the street space to them.

When you measure volume in people rather than vehicles, safety improvements like bike lanes and transit priority increase the street’s capacity while making the streets much safer. Furthermore, as streets get safer with other modes, the more people use those other options, reducing the traffic as a result.
Safer streets are more efficient streets; safer streets can move much higher people-traffic volume.
The real trade-off isn’t safety vs. volume. It’s safety vs. the speed and convenience of a single mode—driving. And when you make that trade-off explicit, the answer becomes obvious.
The projection is a self-fulfilling prophecy#
The project page projects Rose Hill’s traffic will grow from ~7,600 to ~9,900 vehicles per day by 2055—roughly 1% annual growth over 30 years. Where does this number come from? The methodology isn’t documented on the project page, but it’s consistent with a standard compound growth factor applied to current counts.
This is really problematic. And it is not about crude projection. There is a fundamental issue that cannot be addressed by sophisticated traffic modeling.
The projection implies that future traffic is something that happens to a road. But traffic demand is not weather. Future traffic depends overwhelmingly on how the road is designed. This is induced demand at work: build for more cars, and more cars will come; build for people walking and biking, and people will walk and bike.
Although the projection is a self-fulfilling prophecy, it has been used as a justification to widen the road and buldoze low-income neighborhoods.
If you design Rose Hill Drive for 9,900 cars a day, you’ll get 9,900 cars a day. If you design it for safe, comfortable cycling and walking, you’ll get more people cycling and walking—and fewer cars. The projection doesn’t tell us what will happen. It tells us what will happen if we keep designing for cars. That’s not a forecast; it’s a choice disguised as a forecast.
The double standard#
And notice the asymmetry: some projections argue that the US ebike market is growing at ~15% CAGR—far faster than the 1% car traffic growth projected here. Yet no one is using that projection to justify a massive expansion of bikeways. That’s motonormativity again: car traffic growth is treated as inevitable, what will happen to us, and worth planning for, while the explosive growth of other modes is completely ignored.
What Rose Hill Drive should be#
Rose Hill currently carries 6,000–7,600 vehicles per day. With 35 crashes in the past 8 years—including incidents involving pedestrians and cyclists—the 2027 repaving is an opportunity to build for the future. The road that is most convenient for driving—wide, multi-lane, no traffic calming—is the least safe and least efficient option, and it will induce more traffic. The road where transit, cycling, and walking are prioritized is the safest and most efficient option, carrying far more people while reducing traffic and crashes everywhere. The choice should be clear.
If you’re in Charlottesville, consider showing up tomorrow and communicating these messages. These decisions shape the neighborhood for decades.
yy
I posted this on Bluesky too, if you want to chime in.