Traffic calming is cheap
2026-07-12 → 2026-09-13
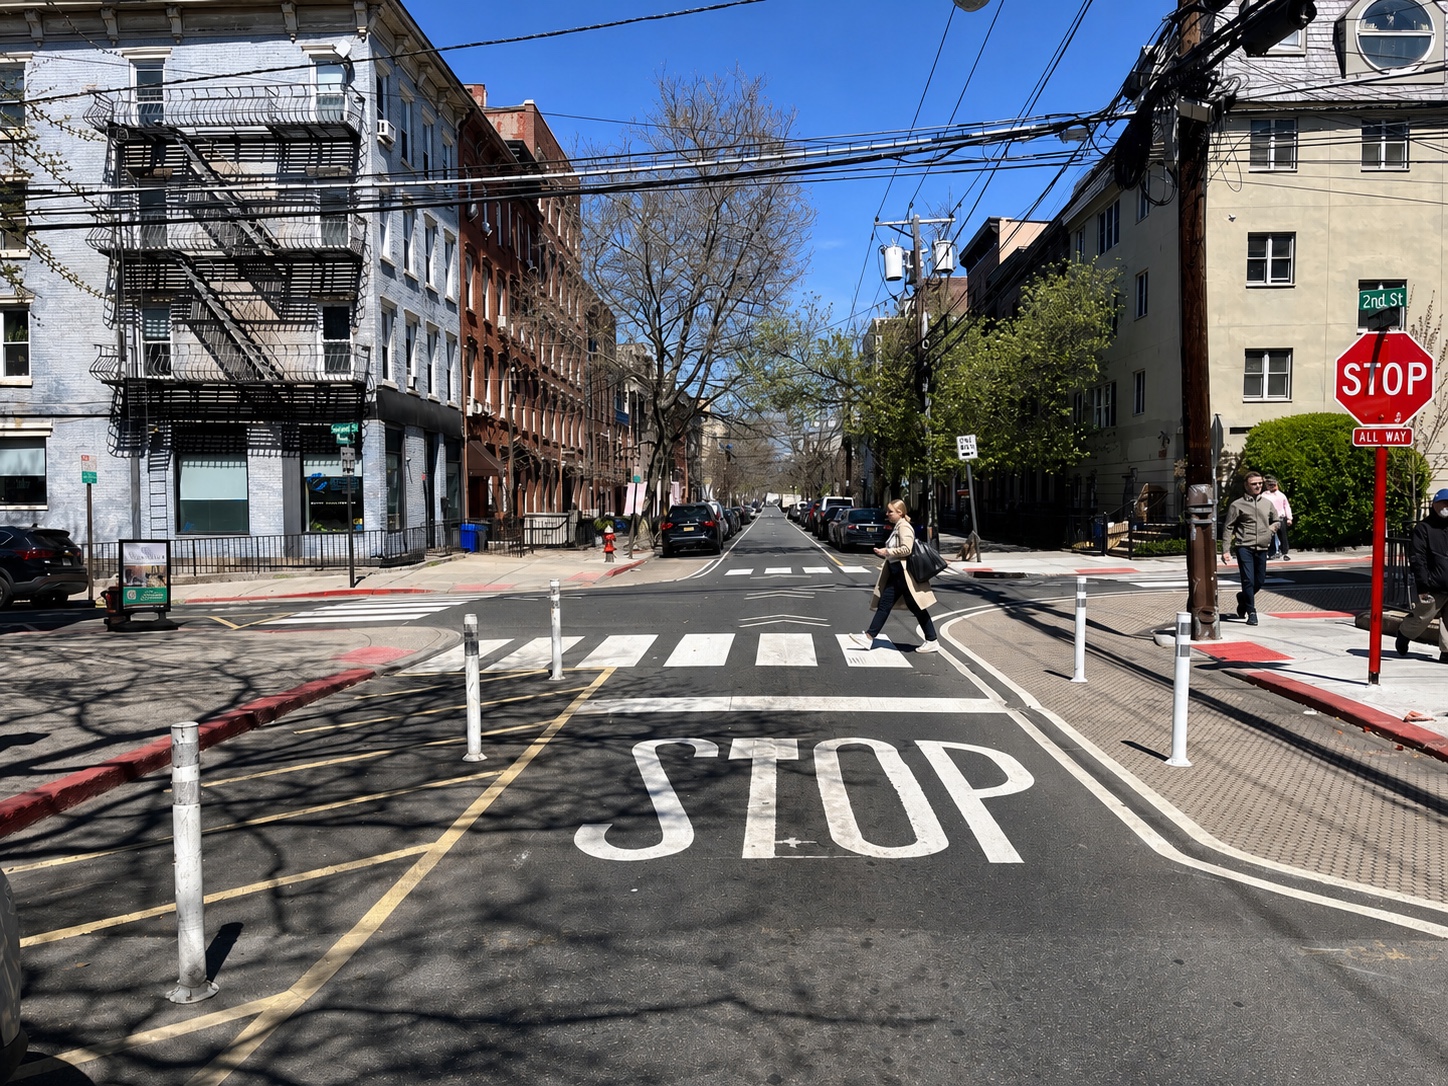
Quick-build traffic calming at Second and Bloomfield Streets in Hoboken: paint, flexible posts, daylighting, and an all-way stop. AI-assisted upscale of a City of Hoboken photograph.
A plastic post that daylights a street corner costs $40 in hardware; a speed hump, about $2,100 installed. A traffic death has no price—no number makes a family whole—but it generates bills anyway: the ambulance and the emergency room, the police and the fire crew, the courtroom, the insurance paperwork, the traffic jammed around the wreck, the lifetime of work that ends. NHTSA’s accounting puts those economic losses at $1.6 million per death; when it then attempts the unpriceable part, valuing the lost life itself, the total reaches $11.3 million—five thousand speed humps for one death. Read that ratio the other way: a city could install five thousand humps—or daylight nearly six thousand intersections, even at generously estimated installed prices—and if they prevent a single death over their whole service life, the entire program has paid for itself.
Traffic calming works. This page adds up the other half of the argument: what calming costs next to the road spending cities treat as normal, what crashes cost, and the side effects, which for most spending sit on the cost side of the ledger but are here benefits—health, local business, climate.
The devices cost thousands; roads cost millions#
How much does traffic calming actually cost to build? The most comprehensive US answer comes from an FHWA-funded compilation of 1,747 cost records, mostly state bid-letting sheets (Bushell et al., 2013): a speed hump costs about $2,100 installed (median; averages around $2,600), a raised crosswalk about $7,100, a chicane about $8,000, a curb extension about $10,000, and a roundabout or traffic circle around $27,000. These are “in the ground” prices, covering labor, materials, mobilization, and contractor profit, in 2012 dollars; CPI-adjusted, the median hump may be about $3,000 today. A one-off retrofit with its own planning process costs more than a device bought twenty at a time—one more argument for a standing program, whose batches and accumulated in-house expertise make each year cheaper than the last—but the order of magnitude is the point: the hardware is thousands, not millions.
The floor of the price list is lower still. The flexible plastic posts Hoboken uses to daylight corners—keeping parked cars back so drivers and pedestrians can see each other—cost about $40 apiece, and Hoboken’s program averages about three of them per treated intersection (418 delineators daylighting 31% of its intersections, which a Results for America case study counts as over 130).1 Delineators are not the only device behind that count—the same case study lists planters and concrete bump-outs alongside them—so three posts is a program average, not a design spec. Call it $130 per intersection—the price of a pair of running shoes, for the device behind a nine-year streak without a traffic death. That is a hardware price, not an in-the-ground price. The bid-sheet compilation has no separate line for flexible posts; its closest category—bollards of every kind, from flexible plastic posts to fixed and decorative bollards—runs about $650 each installed at the median, with observed bids as low as $62. Even taking that as the ceiling, three posts put a daylighted intersection near $2,000—almost exactly the bid-sheet price of one speed hump, in the same 2012 dollars.
A whole calmed street stays cheap. Devices go in every few hundred feet—ITE’s speed hump guidance is 260 to 500 feet apart, close enough that speeds can’t rebound in between—so call it 13 per mile. With humps, that mile costs roughly $40,000 in 2025 dollars. Suppose we use more expensive devices—chicanes, a pricier device that slows cars by bending the roadway rather than bumping over it: a mile of calming still costs only about $150,000. And daylighting at Hoboken’s three-posts-per-intersection average prices a whole mile of intersections—one every 400 feet or so—at about $1,700 in post hardware, less than the cost of one installed speed hump; even at the bollard-ceiling installed price, the daylighted mile comes in around what the mile of humps costs.
Still sounds expensive? Any actual road work makes those numbers look like rounding errors. FHWA’s own investment-analysis figures put an ordinary new urban street—a minor arterial or collector on a new alignment in a large urban area, at normal cost—at about $5.2 million per lane-mile in 2014 dollars, and FHWA’s highway construction cost index has nearly doubled since then (1.68 to 3.23, with 2003 = 1), so a new two-lane mile runs around $20 million today. Nor does a city need to build new roads for the comparison to bite: the same FHWA table puts resurfacing an existing two-lane mile around $1.9 million in 2025 dollars for a large urban area (about $1.5 million in a small urbanized one), and full reconstruction around $7.7 million. Seen from inside a repaving contract, calming is a rounding line: repave the mile and add humps along all of it, and the bill grows by roughly 2–3%—the arithmetic behind folding calming into the repaving schedule by default. A single mile’s repaving contract would fund a dozen miles of chicanes, speed humps along 45 miles of streets, or daylighting post hardware for more than 14,000 intersections—every intersection in Hoboken, more than thirty times over. To be fair, safe-street projects can be expensive too—Hoboken’s full rebuild of Washington Street, its main commercial spine, cost $19.5 million—but that is reconstruction money doing reconstruction; the calming layer behind the safety record is the cheap part.
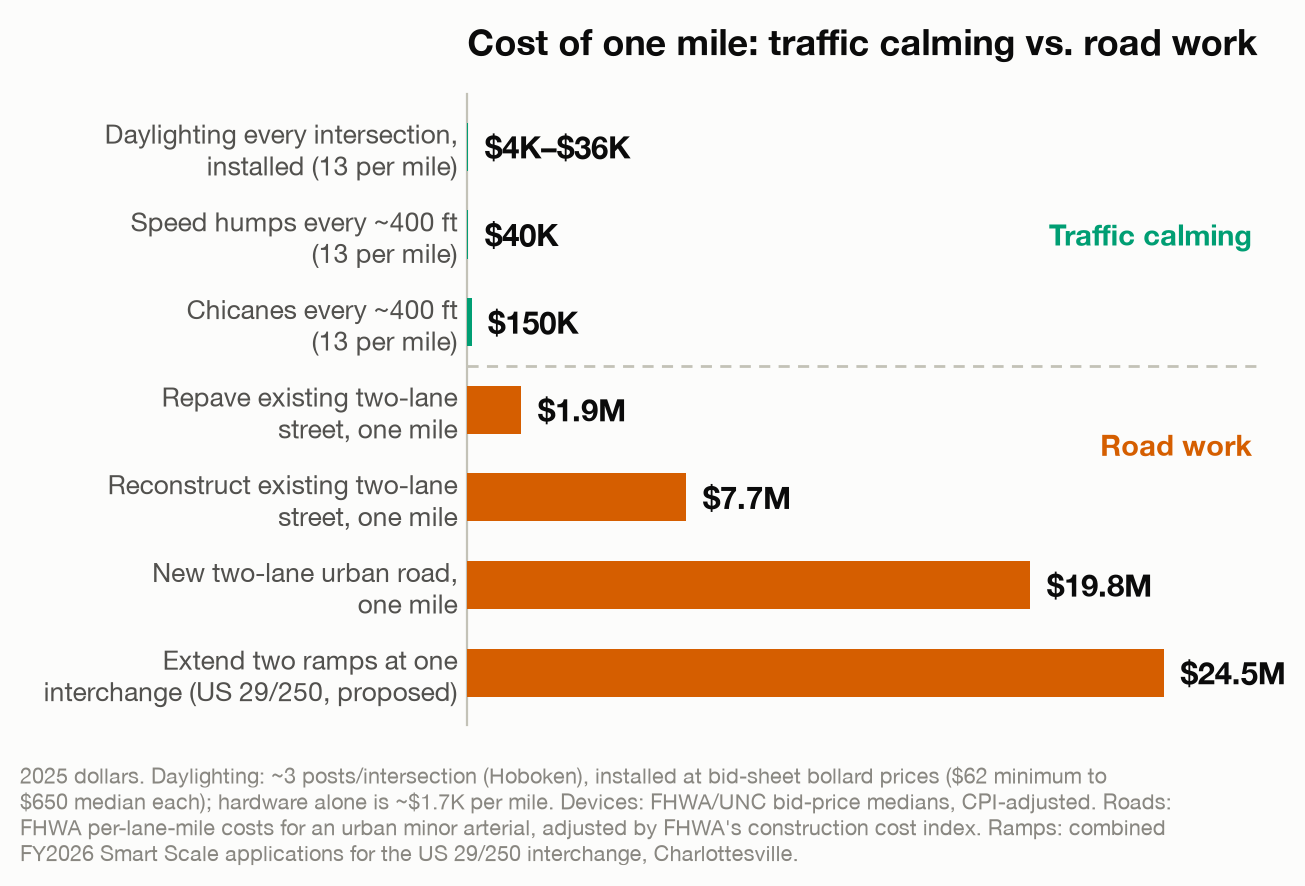
Figure 1: Cost of one mile: traffic calming versus road work.
The longest bar in that chart is not hypothetical for my town: the FY2026 Smart Scale applications to extend two ramps at Charlottesville’s US 29/250 interchange total about $24.5 million—more than building a brand-new two-lane street a mile long, to lengthen two ramps that VDOT’s own congestion data does not flag as congested. Nor is the scale unique to state money: the city’s own Belmont Bridge replacement came in over $31 million, and the West Main streetscape plan grew from about $30 million to over $50 million before the council canceled it in 2022. That is the going rate of routine road work, floated in the same region where the initially proposed annual bike-infrastructure budget line was around $100,000. In other words, if we can forego a single unnecessary highway project, we can completely transform the whole city, making it way safer for everyone.
Freeways are another order of magnitude still: $15.4 million per lane-mile of major-urban freeway at normal cost in 2014 dollars, rising past $64 million in high-cost cases—call it $30 million in 2025 dollars—and single mega-projects exceed entire calming programs: Houston’s I-45 rebuild is a $13 billion effort. One freeway lane-mile buys nearly 10,000 speed humps; at three per street, that calms some three thousand residential streets. The comparison scales all the way up to countries: Wales’s one-day switch of about a third of its road length to a 20 mph default was budgeted at £32.5 million over five years—less than two of those freeway lane-miles for an entire nation.
These are also one-time prices, which sets calming apart from the slowing tools cities rent. Virginia Beach’s new school-zone speed cameras cost up to $3,900 per camera per month—one camera’s yearly lease, about $47,000, is roughly what it costs to hump an entire mile of street, and unfortunately the camera can watch a single spot. Police enforcement is rented by the hour, and its effect on speeds decays within a few kilometres and a few days of the checkpoint. Concrete and posts enforce around the clock, unstaffed, for as long as the pavement lasts.
Crashes are expensive#
Doing nothing has a price too, and it is enormous. NHTSA puts the economic cost of US motor-vehicle crashes at $340 billion in 2019—$1,035 per American per year, 1.6% of GDP—counting lost productivity, medical, legal and court costs, emergency services, insurance administration, congestion, property damage, and workplace losses. With quality-of-life losses included, the total societal harm was nearly $1.4 trillion. Each death carries an average discounted lifetime cost of $1.6 million in economic terms, and $11.3 million with quality of life.
The bill also lands on everyone, not just the people crashing. Public revenues cover about 9% of crash costs—$30 billion in 2019, or $230 per US household in taxes—and roughly three-quarters of all crash costs are paid by people not directly involved, mostly through insurance premiums. Every crash a $2,000 hump prevents is money not spent on emergency response, medical care, courts, and congestion.
At small-city scale the numbers stay large. Take Charlottesville, Virginia (population about 45,000), where I live: in 2024 the city recorded 625 crashes, 2 deaths, and 416 injuries (Virginia DMV). Priced with NHTSA’s per-person unit costs—$1.6 million per death, $143,000 per police-reported serious (“A”) injury, $23,000–$37,000 per lesser (“B” and “C”) injury—and using Virginia’s statewide share of serious injuries (11%) to split the mix, one year of crashes in this one small city costs roughly $23–$30 million in economic terms, and on the order of $130–$180 million in comprehensive societal harm (2025 dollars). This errs low, since it ignores property-damage-only and unreported crashes entirely. For scale, the city’s initially proposed annual bike-infrastructure budget line was about $100,000 (my letter to city council).
Let’s estimate how much traffic calming can save, using published numbers—from the pooled 11% cut in injury crashes across area-wide schemes to the 42% London recorded (the evidence). Even the conservative end is $2.5–$3.3 million a year of avoided economic losses. And the measured average is not the ceiling. Hoboken, an American city of about 60,000 packed into 1.25 square miles, has gone nine consecutive years without a traffic death on a diet of daylighted corners, curb extensions, multi-way stops, and school-zone speed limits: the calming toolbox, applied everywhere. The origin of that program is the cheapest data point in this whole ledger: Hoboken’s daylighting began with the $40 delineators above, and from 2009 to 2011, with these and other pedestrian-safety measures in place, the city recorded a 30% decrease in pedestrian injuries caused by vehicles. National statistics make the same point: the US loses 14.2 people per 100,000 to traffic, against 2.1 in Norway and Sweden (2021 and 2022 figures)—a nearly sevenfold gap. Americans are not subject to different laws of physics; they walk, bike, and drive on poorly engineered streets.
Formal cost-benefit analysis makes the same case with a deliberately narrow ledger. For London’s 20 mph zones, Steinbach et al. weighed construction costs against just one benefit—the value of the casualties avoided—ignoring health, travel time, and the local economy. Even on that ledger, the zones pay for themselves within ten years in any area with at least 0.7 casualties per kilometre of road. A quiet cul-de-sac doesn’t clear that bar, but the streets cities actually target for calming do. In other words, avoided injuries alone repay the construction; every other benefit on this page comes on top.
The delay is marginal#
The standard objection is travel time: slow every car and every errand gets longer, multiplied over every trip in the city. The measured impacts are surprisingly small, because urban door-to-door time is governed mostly by intersections and queueing, not cruising speed—in Transport for London’s summary of the research, “journey times are largely dictated by junction delays and not vehicle speeds”.
England’s 20 mph evaluation put the journey-time increase at about 3% in residential areas: less than half a minute on a two-mile trip, a change most drivers are unlikely to notice. Wales, the largest natural experiment so far, measured it directly: after the national default dropped, journey times on 44 of the 57 monitored routes rose by no more than two minutes, and on all 57 by less than four, while casualties on the affected roads fell 26% in the first year. Seconds per trip bought a quarter fewer people hurt. At bottom, this is not an engineering question but a value judgement: is a minute of driving time—itself uncertain—worth nearly twice the injuries to children? Some redesigns even give time back: Washington State DOT cites an 89% reduction in intersection delays after roundabout conversion in an IIHS study.
Warren Wells makes the category error especially clear. In Halifax, staff reportedly called protected signal phasing “not feasible” because of the delay it would impose on road users. But a treatment that adds delay is not technically impossible; the agency has decided that avoiding delay outweighs the safety benefit. Cost and travel-time estimates inform that choice. They do not make it for us.
The sharper version of the objection is emergency response, and it deserves a straight answer: full-width vertical calming really does slow fire trucks and ambulances. Portland’s field tests measured up to about 9 seconds of delay per hump or table for fire apparatus, and an ambulance field study found 8 to 10 seconds per hump at speed—more when the ambulance is stuck behind other vehicles slowing for the hump. The fix is device choice, not abandoning calming. Speed cushions were invented for exactly this problem—their gaps are placed to match a fire truck’s wide wheel track—and FHWA’s ePrimer is unambiguous about the result: “Field tests have shown speed cushions to reduce general vehicle speeds while providing little to no delay to fire vehicles,” and they “are being used in place of speed humps in many jurisdictions due to their positive reception from fire departments.” Portland’s offset speed tables, the other purpose-built design, brought fire-vehicle delay down to about 2 seconds each, and a calming plan can keep full-width vertical deflection off designated response routes entirely. As for the older claim that humps damage fire trucks, FHWA notes the early studies “found no data to substantiate the claims”.
The side effects are a bonus, not a bill#
Calmer streets nudge people to walk or bike (the evidence), and each shifted trip flips the sign of its externalities. In Gössling et al.’s accounting for the European Union, each kilometre driven by car imposes an external cost of about €0.11 on society, while each kilometre cycled or walked generates an external benefit of about €0.18 and €0.37, largely through health effects.
Health#
The health mechanism behind those numbers is well measured: in a meta-analysis of cohort studies (Kelly et al., 2014), a standardized weekly dose of walking or cycling was associated with an 11% and 10% reduction in all-cause mortality, respectively.
To see the scale in one city, take Charlottesville again. Suppose its roughly 45,000 residents matched what residents living near London’s “mini-Holland” schemes reported—41 more minutes of walking and cycling per person per week, most of it walking. At ordinary walking and cycling speeds (5 and 15 km/h), that is 3.4 to 10 km per person-week, worth about €3 to €4.5 million per year at Gössling et al.’s health-externality values—before adding the €0.11 saved for every kilometre of driving those trips replace. This is a back-of-envelope with generous assumptions (the whole city matching the treated areas’ gain), but the sign and scale are the point: the side effects alone—even without the direct benefits of prevented crashes—are plausibly worth millions a year even in a small city, comparable to what full calming coverage would cost once.
Climate#
Transportation is the largest source of direct US greenhouse gas emissions (EPA), and a typical passenger vehicle emits about 400 grams of CO₂ per mile—about 4.6 metric tons a year. If the shifted trips above replaced driving mile for mile, Charlottesville would avoid on the order of 2,000 to 6,000 metric tons of CO₂ a year, worth $0.4 to $1.1 million at EPA’s central social cost of carbon of $190 per metric ton. Carbon is the smaller prize here—several times smaller than the health benefit above—because the climate case for calming runs through mode shift rather than the devices themselves.
The comparison that matters is with what cities actually fund as climate policy, because typical actions cost real money per ton. In Gillingham and Stock’s review of static abatement costs, weatherization programs run about $350 per ton of CO₂, dedicated electric-vehicle subsidies $350–$640, and solar subsidies $140–$2,100 (2017 dollars). Traffic calming is built primarily for safety; any carbon reduction from trips shifted out of cars is an additional benefit. Assigning it a dollars-per-ton figure requires an actual local program scope, not a hypothetical mileage.
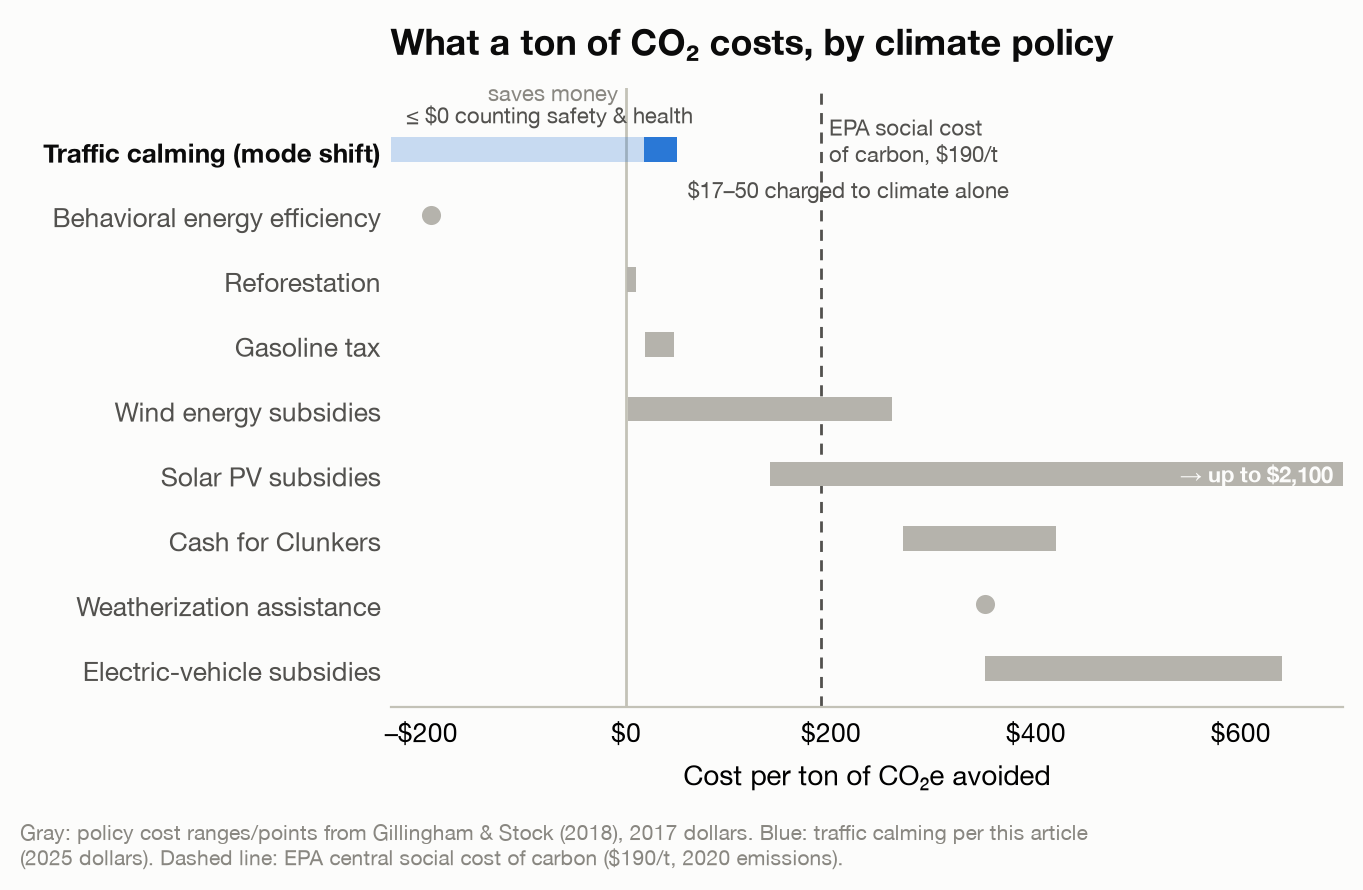
Figure 2: Abatement cost ranges for selected climate policies.
Cost ranges reflect the spread of estimates across studies compiled by Gillingham and Stock (2018), not confidence intervals; dots are single point estimates.
This is also the IPCC’s conclusion at global scale. In the AR6 Synthesis Report’s summary of mitigation options (Figure SPM.7, below), blue marks the options whose net lifetime costs are lower than the reference—mitigation that saves money—and “public transport and bicycling” is solidly blue, alongside fuel-efficient vehicles and demand reduction. The bottom panel puts the demand-side reduction potential of land transport at 67% by 2050, the largest among the end-use sectors shown. Shifting trips out of cars is not a costly sacrifice a city makes for the climate; it is one of the few climate actions that pays for itself.
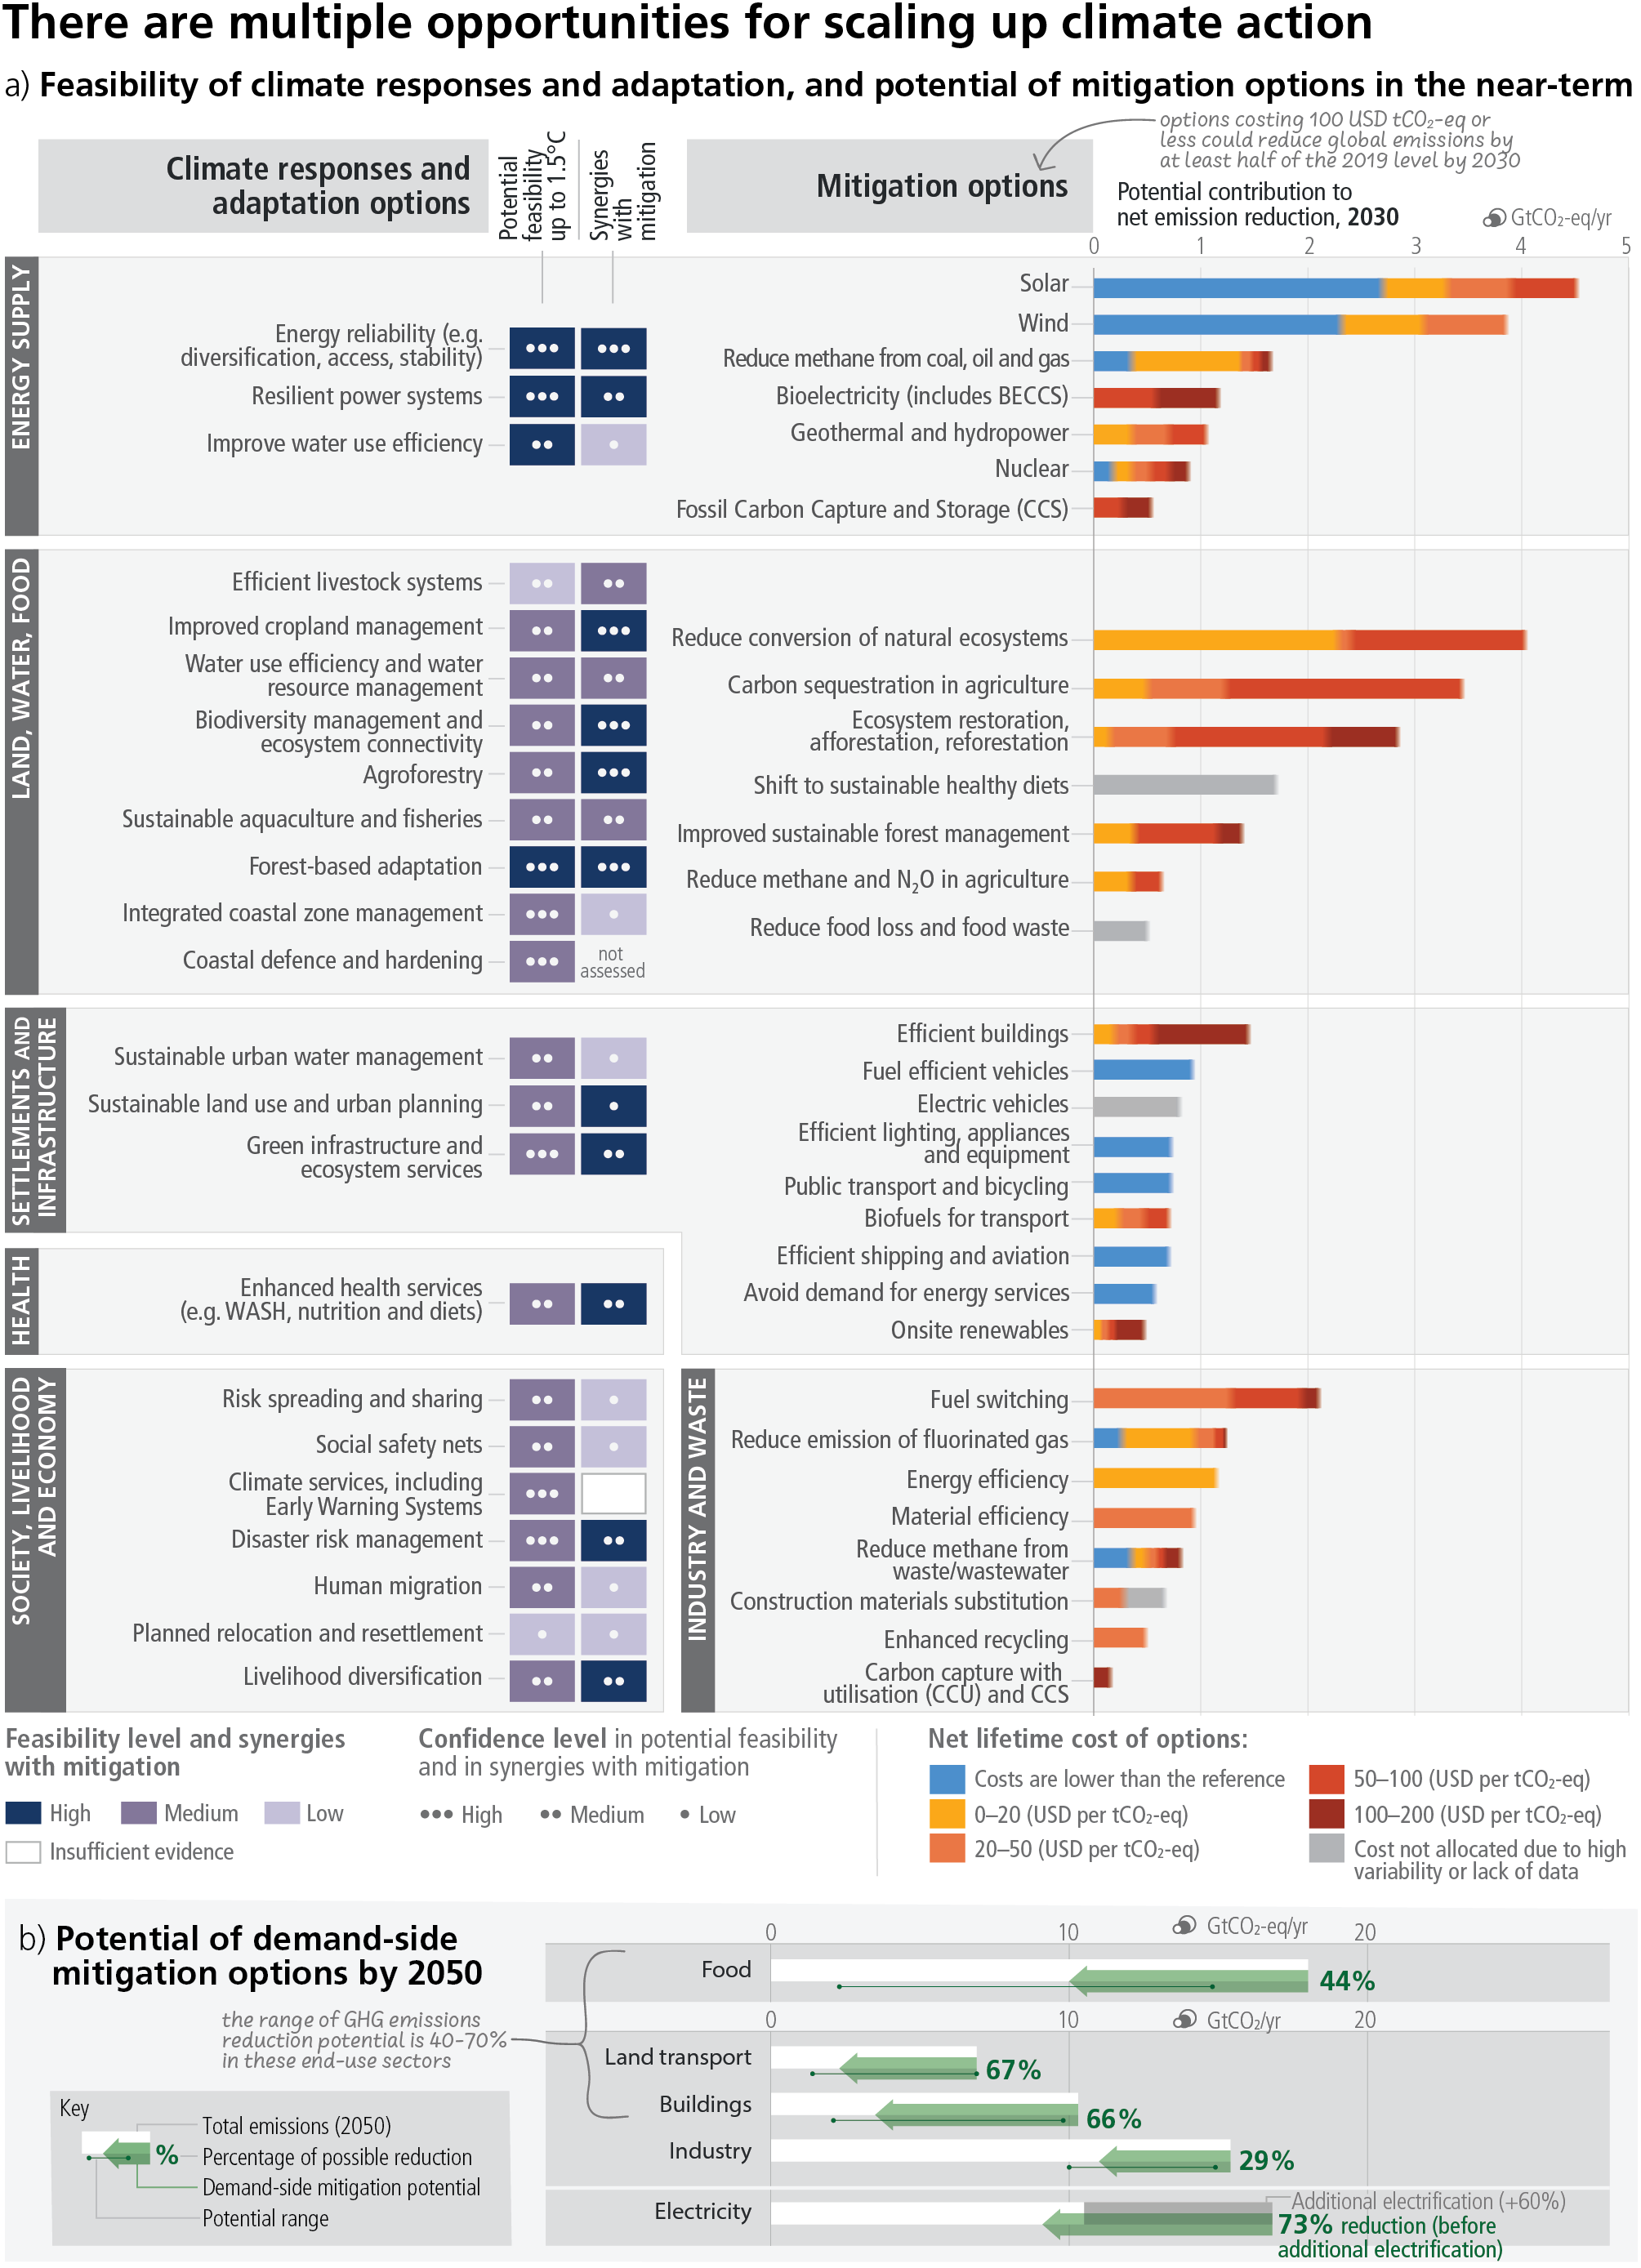
Figure SPM.7 from the IPCC AR6 Synthesis Report (© IPCC): blue bars are mitigation options whose lifetime costs are below the reference case.
A real city’s climate portfolio sharpens the contrast. Charlottesville has adopted targets of a 45% emissions cut by 2030 and carbon neutrality by 2050, and its current climate portfolio is the standard menu: municipal building retrofits under an energy performance contract (saving about 75 tons of CO₂e a year), rooftop solar, a $600,000 LED streetlight conversion, two electric transit buses on order and two electric school buses funded through an EPA rebate, and home-energy grants. Meanwhile community emissions rose about 5% in 2024, and transportation—about 30% of the city’s emissions—has been flat for years while the fleet gets heavier (light-truck mileage up 50% since 2016, per the city’s 2026 Climate Action Update).
Exact dollars-per-ton for these programs mostly can’t be computed from what the city publishes: the retrofit contract reports tonnage and utility savings but not its price, and the LED conversion reports its price but not its tonnage. The one estimate the public numbers allow is rough but telling. Streetlights and traffic signals are about 7% of municipal emissions—roughly 900 t a year in 2024—so even if the $600,000 conversion zeroed the whole category for 15 years, it would come to about $45 per ton, and realistically more: the conversion covers only the Dominion-owned lights, and LEDs cut the load rather than zero it. That is in line with the national benchmarks above, and it is normal—this is simply what climate action costs.
The point is not that these programs are bad (retrofits and solar PPAs largely pay for themselves). The point is that traffic calming is not even trying to be climate policy. A city builds it to stop crashes, and the safety ledger alone repays the construction; the carbon is a byproduct. Yet the byproduct would very likely outperform the dedicated efforts: 2,000 to 6,000 tons a year from a mini-Holland-scale mode shift equals roughly 25 to 80 of those downtown-retrofit contracts—every one of which the city pursued as climate action, paid for as climate action. The tons from calming come along for free, on top of the safety benefits the streets were rebuilt for in the first place. A city that calms its streets gets a climate program without ever budgeting one—and one that removes more carbon than the programs it actually budgets.
Local economy#
The local-economy evidence points the same way: a review of 23 studies by Volker and Handy found that creating or improving active-travel facilities “generally has positive or non-significant economic impacts” on nearby retail and food businesses—I’ve written about this literature, and why it transfers to small towns, in a separate post. The individual results are vivid. After New York installed a protected bike lane on 9th Avenue, retail sales in the project area rose 47% over two years, ahead of both comparison corridors (43% and 23%); on Columbus Avenue the pattern repeated at 20% against 9–12% (NYC DOT). In Toronto, three separate studies of the Bloor Street bikeway found positive economic impact, with average reported customer spending per month rising from $186 to $245. These are bike-lane studies rather than calming studies, but the two are the same project seen from different ends. What keeps most would-be riders off a bike is fast, heavy traffic (the “interested but concerned” majority), so slowing the street is bike infrastructure: a painted lane on an uncalmed street does nothing about the speeds that scare people off, while a calmed street invites riders with or without paint. And both kinds of studies answer the same fear—that making driving slower kills the street—and the answer is no.
The bottom line#
Traffic calming is the rare public investment priced in tens to thousands of dollars set against a problem priced in millions or billions. Freeway money is mostly state and federal, but the comparison holds inside a city’s own ledger: one new two-lane mile runs around $20 million, the price of calming a couple thousand streets. The side effects seal it—health benefits worth millions a year, lower carbon emissions, retail that does as well or better. Whatever is stopping cities from calming their streets, it can’t be the price.
Companion to Traffic calming works and Public preference and street safety.
I posted this on Bluesky too, if you want to chime in.
For school routes and parent organizing, see Safe school streets.
References#
-
Atkins, AECOM, and Maher, M. (2018). 20 mph Research Study: Process and Impact Evaluation—Headline Report. UK Department for Transport.
-
Batson, S. (2004). “Offset Speed Tables for Reduced Emergency Response Delay.” ITE Technical Conference, Irvine, California.
-
Blincoe, L., Miller, T., Wang, J.-S., Swedler, D., Coughlin, T., Lawrence, B., Guo, F., Klauer, S., and Dingus, T. (2023). The Economic and Societal Impact of Motor Vehicle Crashes, 2019 (Revised). National Highway Traffic Safety Administration, DOT HS 813 403.
-
Bushell, M. A., Poole, B. W., Zegeer, C. V., and Rodriguez, D. A. (2013). Costs for Pedestrian and Bicyclist Infrastructure Improvements. UNC Highway Safety Research Center, prepared for the Federal Highway Administration.
-
California Department of Transportation. Traffic Calming Guide.
-
Charlottesville Community Engagement (2026). “April 21, 2026 Edition.” (US 29/250 Smart Scale ramp applications.)
-
City of Charlottesville (2023). Climate Action Plan.
-
City of Charlottesville (2025). News release on municipal energy performance contract upgrades (archived).
-
City of Charlottesville (2026). 2026 Climate Action Report.
-
City of Charlottesville. “5th Street SW Road Diet Bikeway.”
-
City of Charlottesville. “Charlottesville Emissions Reports.”
-
City of Hoboken (2024). “City of Hoboken Reaches New Vision Zero Milestone: Seven Consecutive Years Without a Traffic Death.”
-
Cvillepedia. “Belmont Bridge.”
-
Cvillepedia. “West Main Streetscape.”
-
Environmental Protection Agency. “Greenhouse Gas Emissions from a Typical Passenger Vehicle.”
-
Environmental Protection Agency. “Sources of Greenhouse Gas Emissions.”
-
Environmental Protection Agency (2023). EPA Report on the Social Cost of Greenhouse Gases: Estimates Incorporating Recent Scientific Advances.
-
Federal Highway Administration. “National Highway Construction Cost Index (NHCCI).”
-
Federal Highway Administration (2017). “Traffic Calming ePrimer—Module 5: Effects of Traffic Calming Measures on Non-Personal Passenger Vehicles.”
-
Gillingham, K., and Stock, J. H. (2018). “The Cost of Reducing Greenhouse Gas Emissions.” Journal of Economic Perspectives, 32(4), 53–72.
-
Gössling, S., Choi, A., Dekker, K., and Metzler, D. (2019). “The Social Cost of Automobility, Cycling and Walking in the European Union.” Ecological Economics, 158, 65–74.
-
IPCC (2023). Climate Change 2023: Synthesis Report, Figure SPM.7.
-
Kelly, P., Kahlmeier, S., Götschi, T., Orsini, N., Richards, J., Roberts, N., Scarborough, P., and Foster, C. (2014). “Systematic Review and Meta-Analysis of Reduction in All-Cause Mortality from Walking and Cycling and Shape of Dose Response Relationship.” International Journal of Behavioral Nutrition and Physical Activity, 11, 132.
-
London School of Hygiene & Tropical Medicine (2019). “Transport for London’s Mini-Holland Programme Associated with More Walking and Cycling.”
-
New York City Department of Transportation (2014). Protected Bicycle Lanes in NYC.
-
Öz, E., Küçükkelepçe, O., Kurt, O., and Çavuş, A. C. (2023). “Effect of Speed Humps on Ambulance Delay.” Cureus, 15(1), e33722.
-
Pedestrian and Bicycle Information Center (2013). “Daylighting” (Hoboken, NJ case study).
-
Results for America. “Improving Traffic Safety: Hoboken, NJ.” Economic Mobility Catalog.
-
Steinbach, R., Cairns, J., Grundy, C., and Edwards, P. (2013). “Cost Benefit Analysis of 20 mph Zones in London.” Injury Prevention, 19(3), 211–213.
-
Streetsblog USA (2026). “In New Jersey, Mayors Show How Quickly We Can Slow Down Drivers.”
-
Texas Department of Transportation. “I-45 Construction Begins in Houston.”
-
Toronto Centre for Active Transportation (2019). Bloor Street West Economic Impacts Summary.
-
Transport for London. “Lowering Speed Limits on TfL Roads: FAQs.”
-
Transport for Wales (2025). Default 20 mph Speed Limit on Restricted Roads: National Monitoring Report.
-
University of Kentucky Safe Design. “Speed Hump.”
-
Victoria Transport Policy Institute (2023). “Roadway Costs.” Transportation Cost and Benefit Analysis II.
-
Virginia Department of Motor Vehicles (2025). Virginia Traffic Crash Facts 2024.
-
Volker, J. M. B., and Handy, S. (2021). “Economic Impacts on Local Businesses of Investments in Bicycle and Pedestrian Infrastructure: A Review of the Evidence.” Transport Reviews, 41(4), 401–431.
-
Washington State Department of Transportation. “Roundabouts.”
-
Wells, W. (2026). Post on feasibility, delay, and traffic safety. Bluesky.
-
WHRO (2025). “Virginia Beach Gives Green Light to Speed Cameras in School Zones.”
-
Wikipedia. “List of Countries by Traffic-Related Death Rate.”
-
Wikipedia. “Restricted Roads (20 mph Speed Limit) (Wales) Order 2022.”
-
The arithmetic: 418 delineators ÷ ~130 daylighted intersections ≈ 3.2 posts per treated intersection, and 130 ÷ 0.31 implies about 420 intersections citywide. A full four-corner treatment at two posts per corner would be about eight posts—still only ~
$320in hardware. ↩