Traffic calming works
2026-07-10 → 2026-09-13
Every residential street in your city comes in two versions. They cost about the same, and trips take about as long on either. But the slightly cheaper version injures substantially more people—and kills or seriously injures nearly twice as many children. So at the end of the day, you pay way more than what you save for the street just for the injuries alone, and then the safer version brings so many extra economic and social benefits. Which one would you choose?
Sounds like a no-brainer? The crazy thing is that almost no American city has been picking the safer and cheaper version except a few places. Hoboken did—a city of 60,000 across the Hudson from Manhattan that has not lost a single person to crashes in nine years. The tools behind that streak are humble plastic posts, paint, curb extensions, and daylighted corners: cheap changes that make its streets feel like places to drive slowly, thus safely.
Speed kills twice: faster cars are more likely to crash, and the crashes that happen are more likely to kill. Lowering speed is the whole game—but changing the number on a sign usually changes driving speeds only slightly. Traffic calming1 changes the street itself, making the safe speed feel like the natural speed. This page follows that chain from speed, to street design, to measured crashes; the costs are marginal against the safety gained—even negative once every benefit is counted.
Speed kills#
Faster cars are more likely to crash because they need way more room to stop. Stopping distance has two parts: the distance traveled while a driver perceives and reacts, which rises directly with speed, and the distance covered under braking, which rises roughly with the square of the speed. For instance, under FHWA’s conservative road-design assumptions—2.5 seconds to perceive and react, then 11.2 ft/s² deceleration—stopping from 20 mph takes 115 feet; at 40 mph, it takes 305 feet, about a football field.
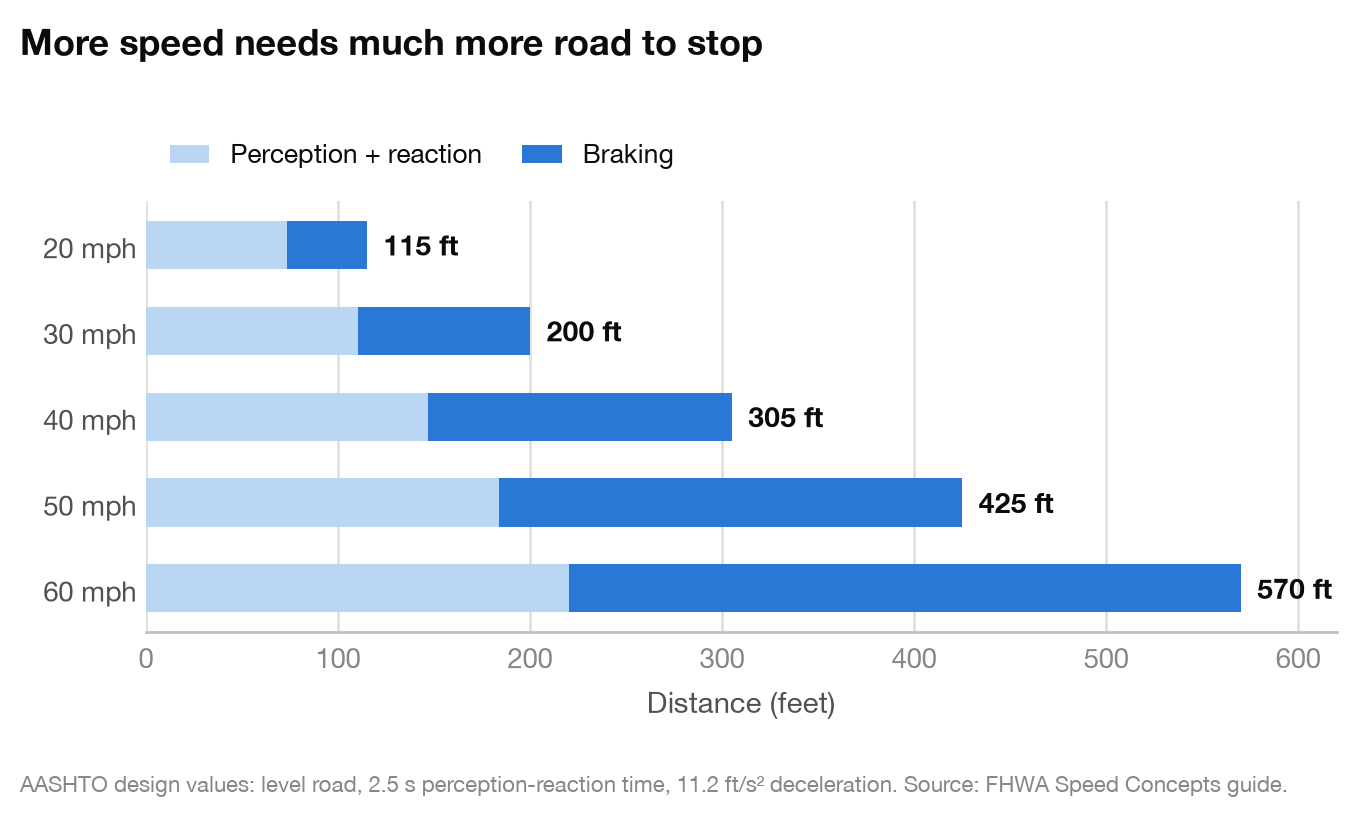
Figure 1: Stopping distance includes perception-reaction distance and braking distance.
The crash statistics point the same way. Under the “power model” proposed by the Swedish researcher Göran Nilsson in 1981, injury crashes rise with roughly the square of mean speed. This means even a modest drop in speed removes a disproportionate share of collisions.
When crashes happen, speed dictates severity#
Speed also determines the amount of kinetic energy transferred to a human body in a crash. In Brian Tefft’s analysis for the AAA Foundation, a struck pedestrian’s average risk of death is about 10% at an impact speed of 23 mph, 50% at 42 mph, and 90% at 58 mph. Stack this on top of fewer crashes overall, and the worst outcomes fall fastest when speed goes down. Nilsson’s original power model estimates fatal crashes using the fourth power of the ratio of mean speeds: a 10% increase in mean speed predicts about 46% more fatal crashes ($1.1^4 \approx 1.46$), while a 10% reduction predicts about 34% fewer ($0.9^4 \approx 0.66$) (Cameron and Elvik 2010). Mathematically, doubling speed would imply 16 times as many fatal crashes, although it is an extrapolation.2
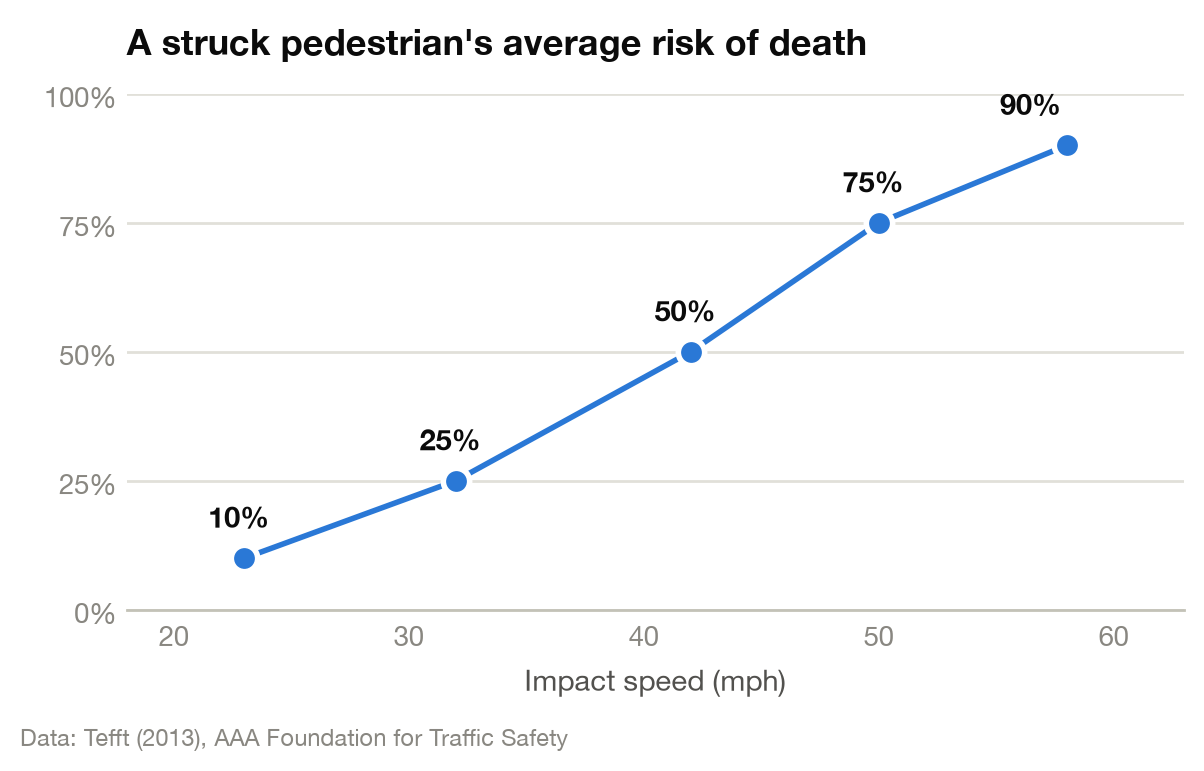
Figure 2: A struck pedestrian’s average risk of death by impact speed.
The severity effect also appears in evaluations of slower street designs. In London’s physically calmed 20 mph zones, deaths and serious injuries to children fell by roughly half. On trunk roads through towns in Ghana, a quasi-experimental study found 77% lower adjusted odds of a worse injury outcome in towns where speed humps were installed than in control towns (OR 0.23, 95% CI 0.11 to 0.47)—a comparison of how badly crashes ended, not of how many happened. Converting an intersection to a roundabout—intersection control rather than strictly a calming device, but one that slows traffic through the intersection—reduces fatal and serious-injury crashes by an estimated 78% when it replaces a traffic signal and 82% when it replaces a two-way stop.
A speed-limit sign usually does little#
Drivers take their speed from the street more than the sign. Justine Underhill’s video below, “Why speed limits don’t matter,” makes this point convincingly: the posted limit often changes driving speeds only slightly when the street itself stays the same. England’s national evaluation of signed-only 20 mph limits estimated that the policy reduced residential median speeds by just 0.38 mph relative to comparison areas, with insufficient evidence of any change in casualties. A three-year evaluation of Belfast’s city-centre 20 mph limit likewise found little change in speed, collisions, or casualties.
The American record agrees. When FHWA studied 100 sites across 22 states where posted limits were raised or lowered, mean and 85th-percentile speeds changed by no more than 1–2 mph, and crash changes were not statistically significant: “neither raising nor lowering the speed limit had much effect on vehicle speeds” (Parker 1997). Portland’s “20 is plenty” campaign lowered residential limits from 25 to 20 mph; across 58 monitored sites, average speeds were essentially unchanged (21.66 mph before, 21.70 mph after), though the odds of observing speeds above 30 mph fell by about a third.
Signs are not completely inert though: Wales recorded a larger change after making 20 mph the national urban default. But the contrast between these cases shows that scale and implementation matter, and a sign alone is not reliably self-enforcing.
Traffic calming is what works#
Traffic calming works through physics and psychology. When the road is physically challenging to navigate at high speed, drivers slow down; when speeding feels dangerous to the driver, they slow down. The design makes the lower speed self-enforcing, 24 hours a day.
Police enforcement cannot substitute for this, because its effect is local and temporary. In the European Commission’s synthesis of speed-enforcement research, the effect of a visible stationary check on driving speeds halves every 900 meters beyond the checkpoint and typically extends 2.4 to 8 km, and the effect of visible camera operations dissipates after about three days. Getting a network-wide effect from enforcement requires unpredictable checks across a large part of the network—a permanent, large-scale police operation. The British nickname for a speed hump, “sleeping policeman,” captures the alternative: it does the same job at every hour, with no staffing.
The size of the speed change varies substantially across implementations. Across 32 British 20 mph zones with physical measures, mean speeds fell by 9.3 mph, to roughly 16 mph. Wales, which made 20 mph the national urban default, recorded a 3.4 mph reduction in the traffic-weighted 85th-percentile speed at 43 monitored main-road sites, which Transport for Wales cautions are not representative of every 20 mph road. The three evaluations below differ in country, period, site selection, and speed metric; read them as the range of measured changes, not a dose-response curve.
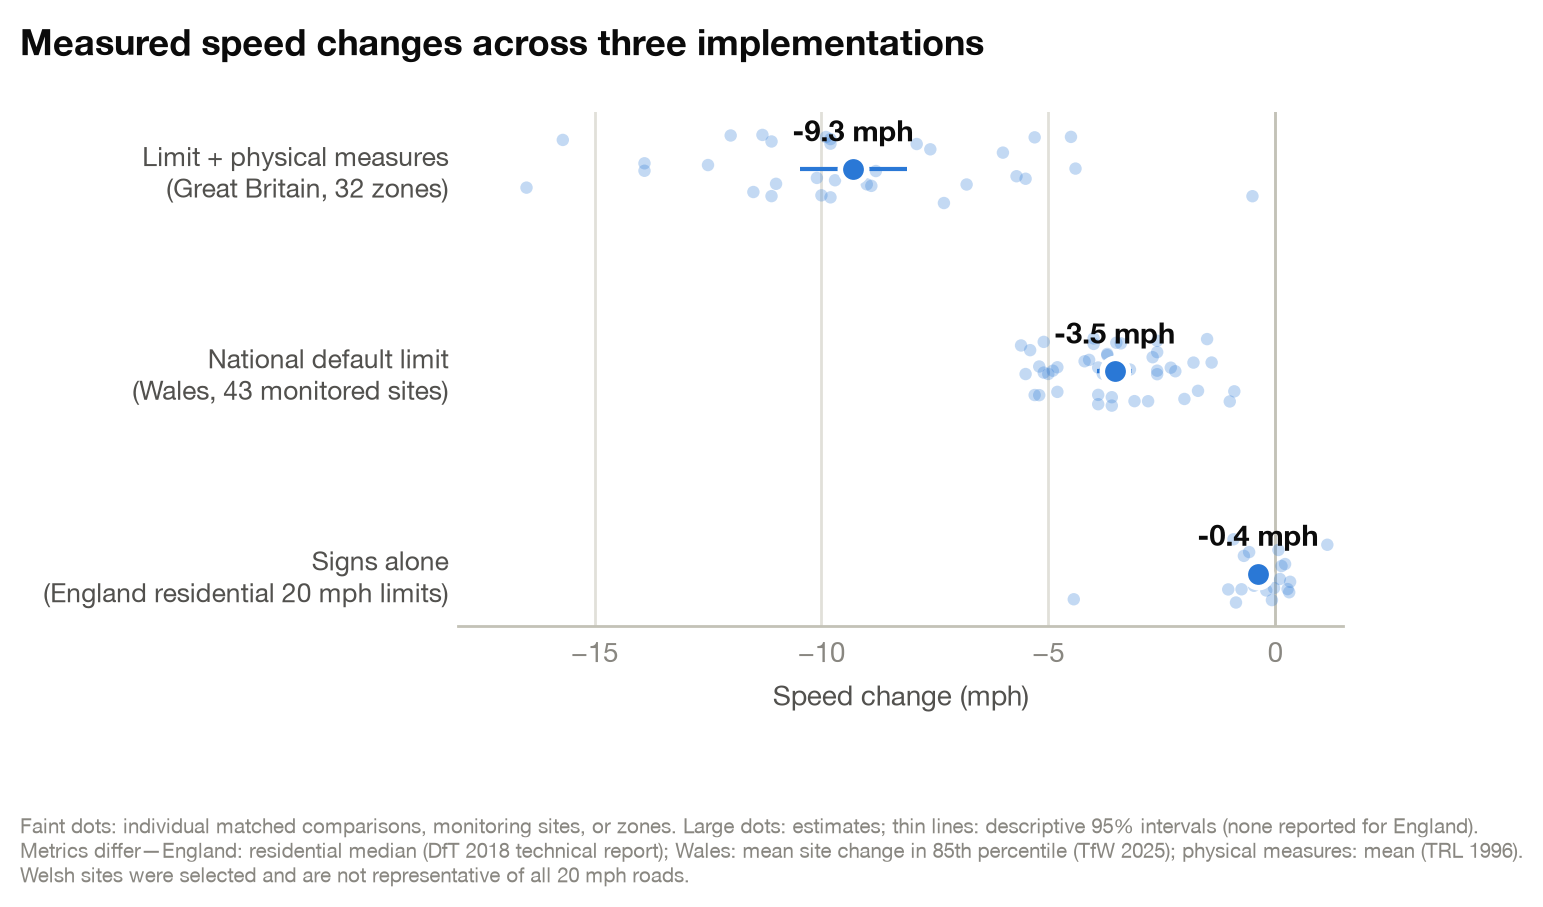
Figure 3: Speed changes reported in three evaluations.
Even removing paint calms traffic. When Transport for London stopped reinstating centre lines on three resurfaced 30 mph roads, measured speeds fell at every site; and because the control stretch showed that a fresh, smooth surface by itself raises speeds by about 4.5 mph, TfL’s corrected estimates of the centre-line effect were 5.4 to 8.6 mph. Its explanation is the psychology above: the centre line assures drivers that oncoming traffic will stay off “their” half of the road, and removing it “introduces an element of uncertainty which is reflected in lower speeds.” This calming measure costs less than doing nothing, since the city skips the repainting.
The safety gains show up in the data#
Grundy et al. estimated the effect across London’s 20 mph zones:
The introduction of 20 mph zones was associated with a 41.9% (95% confidence interval 36.0% to 47.8%) reduction in road casualties, after adjustment for underlying time trends. The percentage reduction was greatest in younger children and greater for the category of killed or seriously injured casualties than for minor injuries.
In those London 20 mph zones, road casualties fell about 42%.
Casualties in adjacent areas also fell, by 8.0% (95% CI 4.4% to 11.5%), which suggests the zones spread calm to neighboring streets rather than pushing dangerous driving across the boundary—though Grundy et al. did not measure traffic or speeds in those areas, so the mechanism remains uncertain.
Similar estimates show up outside Britain. On 404 Toronto roads, Rothman et al. found that pedestrian–vehicle collisions fell by 22% after speed humps were installed (95% CI 9% to 34%); among children, they fell by 44% (21% to 60%). An Oakland matched case-control study found that children living within a block of a speed hump had about half the adjusted odds of being injured as pedestrians in their neighborhood (OR 0.47, 95% CI 0.24 to 0.95).
New York City’s Safe Routes to School program, which bundled speed humps with signals, high-visibility crosswalks, and other street changes, cut school-age pedestrian injuries during school-travel hours by 44% (95% CI 17% to 65%) in intervention areas while comparison areas saw no change (0%, 95% CI −8% to 8%); the estimate belongs to the package, not to any one device.
The Cochrane review gives the most cautious summary: a pooled 11% reduction in injury crashes (rate ratio 0.89, 95% CI 0.80 to 1.00), an interval that just touches no effect. It found no randomized trials, only 16 controlled before-after studies, and no clear pooled reduction in deaths or in pedestrian-vehicle collisions. The authors called area-wide calming promising and asked for more rigorous evaluations.
Newer work reinforces both the safety case and the need to specify where and how calming is used. A 2024 synthesis of 23 publications concluded that 20 mph limits and zones improve road safety, while highlighting persistent problems with exposure measurement and natural-experiment designs. A spatiotemporal analysis in Montreal found weak evidence across the whole road network, where most serious collisions occurred on arterials and most calming was installed elsewhere. At intersections on local roads, however, calming was associated with a substantial reduction in fatal or serious collisions (IRR 0.31, 95% credible interval 0.12 to 0.86). The evidence is strongest for self-enforcing, area-wide measures on local residential streets; the road type and implementation details matter.
The estimates below summarize the reported safety effects across interventions and populations.3 The child-specific estimates are among the largest, clustering around a 40–50% reduction.
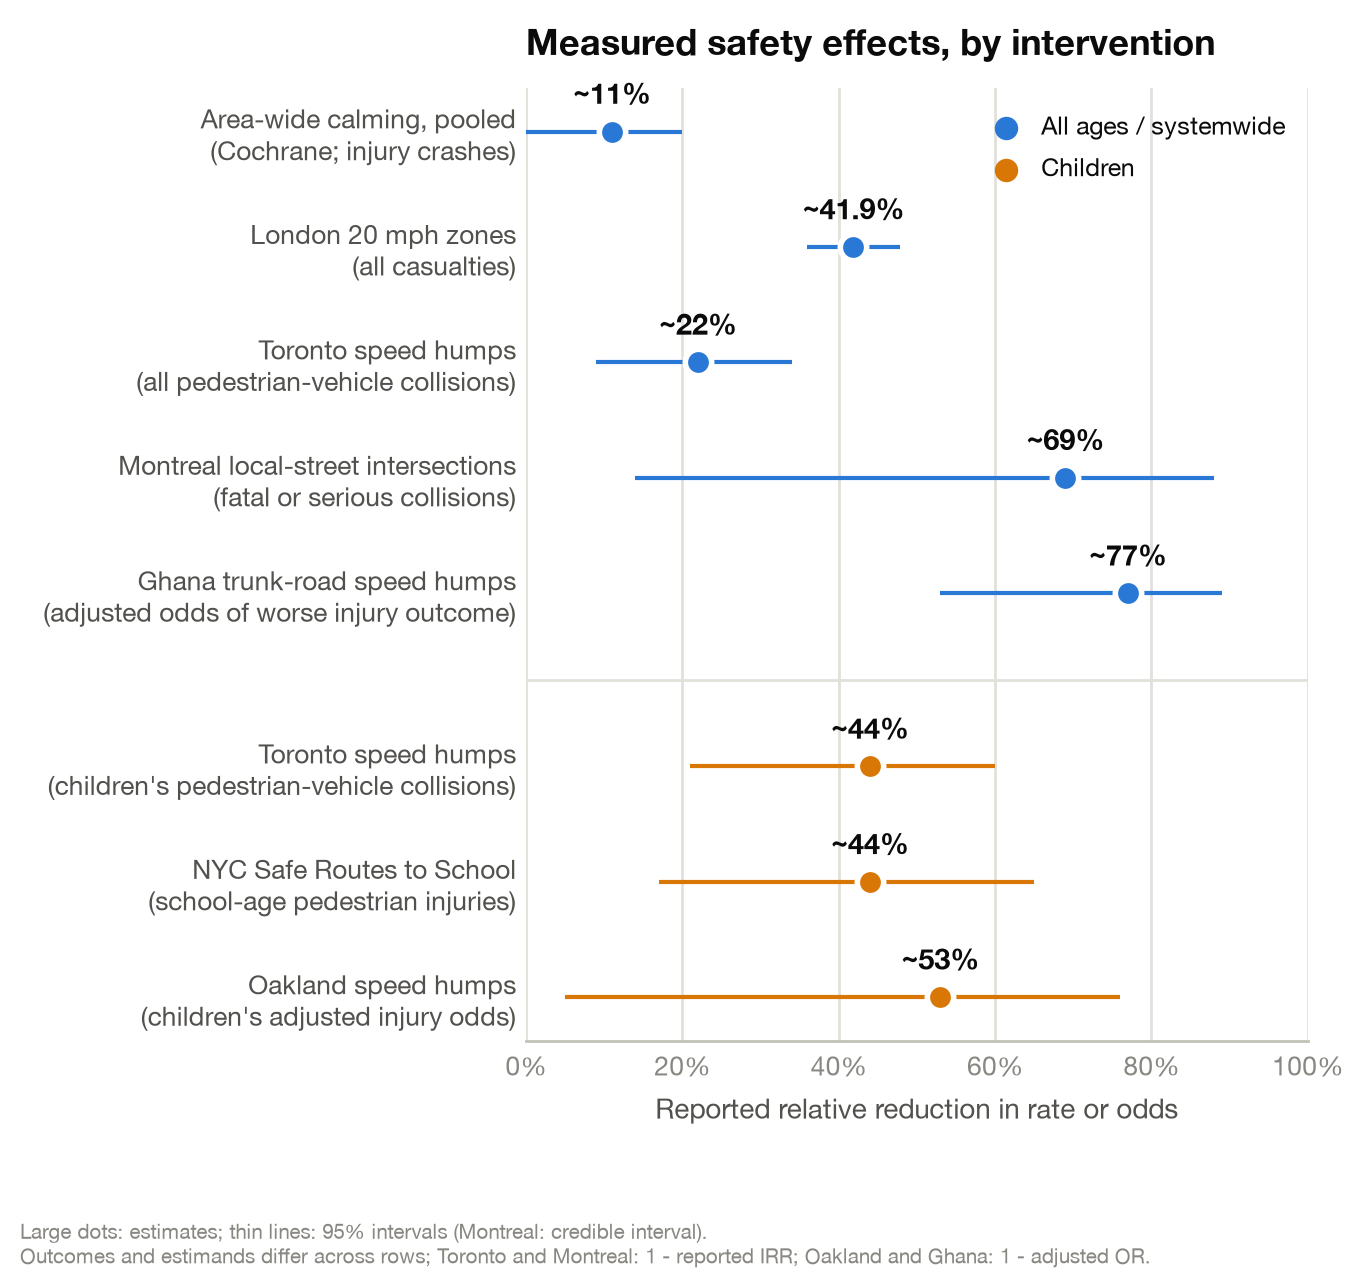
Figure 4: Measured safety effects by intervention and population.
The time cost to drivers is usually modest#
Then what do we lose? Wouldn’t traffic calming slow down driving too much? The measured time penalties in these evaluations were generally modest. England’s 20 mph evaluation put the journey-time increase at about 3% in residential areas—less than half a minute on a two-mile trip. After Wales changed its national default, 44 of the 57 monitored route-and-time combinations that became slower added no more than two minutes. Casualties on 20 and 30 mph roads fell 26.2% in the first 12 months, although Transport for Wales cautions that it is too early to attribute the change to the policy.
Warren Wells draws an important line between feasibility and priority. In the Halifax case he cites, staff called protected signal phasing “not feasible” because it would delay road users. The treatment was physically possible; the decision turned on how much delay to accept in exchange for safety. Calling that choice infeasible hides the value judgment instead of defending it.
Impact on emergency response is also modest and often engineerable#
Emergency response can be a genuine design constraint, and it is also where the evidence is most reassuring. Conventional humps and tables do delay fire vehicles—Portland’s field tests measured between zero and about 9 seconds per conventional speed table, depending on the vehicle. But the FHWA ePrimer reports that field tests show speed cushions, which leave gaps matched to a fire truck’s wide wheel track, “reduce general vehicle speeds while providing little to no delay to fire vehicles,” and Portland’s offset speed tables cut the worst-case delay from about 5 seconds to about 2. The older claim that humps damage fire trucks fared worse: FHWA notes the early studies “found no data to substantiate the claims.” The tradeoff is real on a hump-lined response route and largely designed away with the right device—a calming plan keeps full-width vertical deflection off designated response corridors and uses cushions or offset tables there instead (more on the devices). Whatever delay remains has to be weighed against the much larger human cost of a serious crash.
The other tradeoffs likewise come down to device choice and placement, not to calming itself. Vertical deflection can be uncomfortable for ambulance patients and transit riders, routing restrictions can redirect traffic, and a 2026 systematic review of vertical measures found that braking and acceleration around them can raise local noise and emissions. The menu of devices is wide—cushions, offset tables, chicanes, narrowing, circles—precisely so a plan can fit the street’s other jobs.
Slow cars sometimes mean faster trips#
Ironically, slowing cars through traffic calming can even make a trip faster. On South Golden Road in Golden, Colorado, the city rebuilt a half-mile corridor, replacing two signals and two stop-controlled intersections with four roundabouts. The 85th-percentile speed fell from 48 to 33 mph, yet travel time fell 13%, from 78 seconds to 68 seconds. On a short urban trip, the seconds gained by driving faster between intersections can be smaller than the time lost stopping and queuing at them.
That result is not unique. A before-and-after study of three US intersections found that replacing signals or stop signs with roundabouts cut peak-hour delay by 83–93%. A Kansas study of 11 roundabouts found statistically significant reductions in delay, queues, and stopping at all 11 sites. Roundabouts do not win everywhere: the best control still depends on traffic volumes, turning patterns, and the surrounding signal network (National Academies’ guide). But slower traffic and a shorter trip are entirely compatible when the street removes enough waiting.
Justine Underhill illustrates the mechanism with University Avenue in Provo, Utah. In “Get to work faster with lower speed limits?”, she cites 100 observed trips on the 35 mph street whose average speed was below 15 mph, with drivers stopped at signals 37% of the time. She then proposes replacing frequent signals with roundabouts and yield control, lowering the limit to 20 mph, and prioritizing walking and cycling. The baseline figures are measured and the redesign is hypothetical, but the logic matches the cases above: fewer full stops can raise average travel speed even while peak speed falls.
Traffic calming may reduce the traffic itself#
The travel-time figures follow vehicles that continued to use the monitored routes. They do not count people who changed routes or modes, or trips that disappeared altogether. Calming can divert through-drivers to roads intended for faster traffic, while mode shift and evaporation reduce total driving. In the Lambeth LTNs discussed below, annual mileage among residents’ permit vehicles fell 6.4% relative to controls, while vehicles registered near the LTNs showed no significant change. That result does not show how traffic changed on every street, but it does show that travel demand need not remain fixed. Where a scheme reduces the number of vehicles entering a street, less queueing can offset some of the delay from lower cruising speeds.
The full accounting of these costs leaves the bottom line intact: the time penalty is generally small beside the safety gain.
It can get people out of cars#
When walking or biking feels dangerous, inconvenient, or unpleasant, fewer people choose it. Make that mode safer, more comfortable, and more useful, and more people will use it. Travel behavior responds to the conditions cities build. A 2024 systematic review of 78 active-travel interventions found that increasing walkability increased walking and that programs combining infrastructure with other support produced the largest gains, though it also found that small cycling projects often shifted existing riders to a new route without increasing total cycling, and most included studies carried a medium or high risk of bias. The quality and completeness of the network matter.
Direct evidence from traffic calming#
Studies of traffic calming itself generally find modest rather than dramatic changes in how people travel—though one caveat applies throughout this section: mode shift can build gradually as households change routines or give up a car, so an evaluation window of a year or two may capture only the start of it. In a prospective Glasgow study, researchers counted pedestrians before and after the city added speed cushions, zebra crossings, and parking bays. Six months later, 20% of surveyed adults said they walked more, and pedestrian counts rose at most sites and across most age groups—though with no comparison area and low survey response rates, this is weak evidence on its own. England’s larger evaluation of signed-only 20 mph limits, a weaker intervention, found that 5% of residents said they walked more and 2% said they cycled more.
Low-traffic neighbourhoods test the question more directly because they use modal filters to remove through traffic while lowering speeds. In a longitudinal comparison of new, low-cost London LTNs, residents walked about 61 more minutes and drove about 44 fewer minutes per week than controls, though with only 65 participants during the COVID-19 pandemic, the estimates are suggestive rather than firm.
A larger Lambeth study used parking-permit records matched to annual odometer readings. After four LTNs were introduced, cars and vans registered inside them travelled 1.3 km less per day relative to controls (95% CI 0.3 to 2.4), a 6.4% reduction; vehicles registered near the LTNs showed no significant change. The study covered only permit-holding vehicles in inner London, but it measured total annual driving rather than self-reported behavior.
A later controlled study of three Southwark LTNs found lower traffic speeds and volumes but no significant change in neighbourhood-wide walking or cycling counts after one year. Mode shift can take longer. In the small sample from Waltham Forest’s longer-running LTNs, the adjusted gap in car ownership grew across three annual follow-ups, reaching 20% by year three, while active-travel effects also grew over time. A NICE review of eight UK traffic-calming studies found the same mixed pattern: five reported small increases in walking, cycling, or children’s outdoor play, while three found no change or slight declines.
Indirect evidence from safer walking and cycling networks#
The indirect evidence helps explain why the results depend on the surrounding network. Fear of traffic keeps many potential riders off bikes. In Jennifer Dill and Nathan McNeil’s Portland survey, roughly 56% of adults were “interested but concerned”: interested in riding, but wanting separation from fast or heavy traffic. That is a measure of attitudes rather than of any intervention, but it shows how common the discomfort is. Slower approaches can also make crossings easier for people who need more time, including wheelchair users, older adults, and children.
Programs that make whole networks safer show the scale of change cities have observed. Seville built its entire 77 km basic network of connected, protected bike lanes in under two years, 2006–2007, and cycling rose from negligible levels (0.6% of trips in a 1990 survey) to more than 5% of the modal split, with the network carrying about 70,000 trips a day by 2011. An evaluation of London’s “mini-Holland” schemes found that residents of the most-treated (“high-dose”) neighbourhoods reported about 41 more minutes of walking and cycling per week than comparable outer-London residents after one year. Both programs combined dedicated cycling infrastructure with traffic calming, so neither study isolates the effect of lower speeds. They show what can happen when safer streets connect into useful routes.
Together, these studies suggest that traffic calming can help people switch modes, especially when a calmer street becomes part of a connected route. One isolated block is unlikely to produce the change seen across a whole network. Even a modest shift matters for street capacity because walking, bikes, and transit use far less space per person than cars.
Cities are doing it in years, not decades#
Then, how quickly can a city reap these benefits? The urgency is real—US pedestrian deaths are 48% higher than a decade ago (the fuller American picture)—and the record’s answer is encouraging: cities that decided to act transformed their streets within a few years, sometimes within a day.
The one-day versions are speed-limit defaults. Wales moved about a third of its road length to a 20 mph default on September 17, 2023, in a single legal changeover. Brussels made 30 km/h the region-wide default on January 1, 2021, mostly with signage; road deaths fell from 14 in 2020 to six in 2021, serious crashes fell 20%, and the measured travel-time cost was 10–15 seconds on trips of 5–10 km.
Amsterdam lowered a large share of its 50 km/h streets to 30 in one go in December 2023—about 4,500 new signs and 140 reconfigured traffic lights; in the city’s first-year evaluation, crashes involving a motor vehicle on the converted roads fell 11%, and the share of drivers going over 55 km/h dropped from 1% to 0.2% (crashes also declined on unchanged roads, so not all of the drop is the limit). These are sign-based changes, the weaker lever from the sections above; delivered as universal defaults with loud public debate around them, they nevertheless moved speeds and casualties in a way scattered signed limits have not, and they set the baseline for physical calming to lock in.
The quick-build programs show what a few years of paint, posts, and humps can do. Hoboken’s signature move is daylighting—clearing parked cars from the corners so drivers and pedestrians can see each other, with the space held by delineators, bike racks, or planters. It started cheap and stayed cheap: the original vertical delineators cost about $40 apiece in hardware, and from 2009 to 2011, with these and other pedestrian-safety measures in place, the city recorded a 30% decrease in pedestrian injuries caused by vehicles. After a 2019 Vision Zero pledge, the city applied the toolbox everywhere—418 delineators daylighting 31% of intersections by early 2024, plus curb extensions and a 15 mph school-zone speed limit on 67 blocks. That is the machinery behind the streak this page opened with, nine years and counting as of mid-2026.
Next door, Jersey City committed to Vision Zero in 2018 and began with paint and flexible posts; by the end of 2023 it had installed more than 680 speed humps, upgraded over 150 intersections with quick-build curb extensions, and implemented 21 miles of protected bike lanes. Paris calmed 218 school streets between 2020 and late 2024—roughly one a week—and converted Rue de Rivoli, its central artery, to bikes and buses within weeks in spring 2020, permanent by that September. Somerville, Massachusetts, three years without a traffic death, installs calming through its routine repaving schedule—more than 70 features last year alone; on stretches of its rebuilt Cameron Avenue, the share of drivers clocked above 25 mph fell from more than 80% to 2%.
Even the deadliest corridors turn around on this timescale. Queens Boulevard in New York, “the Boulevard of Death” where nearly 400 people were killed between 1950 and 2000, began a phased redesign in 2015—fewer travel lanes, protected bike lanes, pedestrian islands, retimed signals—and along the redesigned sections, fatalities fell 68%, injuries 35%, and pedestrian injuries 45%. The final phase finished in November 2024: nine years for seven miles of one of the most notorious roads in America.
Some cities are also removing the street-by-street fight. Cambridge, Massachusetts passed one of the first ordinances in the US (2019, strengthened 2020) requiring separated bike lanes whenever a street on its five-year reconstruction plan is rebuilt, with about 25 miles mandated on a deadline; neighboring Somerville followed in June 2024 with a unanimously passed Safe Streets Ordinance that extends the same logic to pedestrian and transit improvements “whenever improvements are made to a public street.” The implementations have kinks to iron out—Cambridge’s deadline slipped to late 2026 after a council fight—but the direction is right: safety as the default, installed by routine maintenance rather than won street by street through petitions.
Speed and cheapness go together: delineator hardware costs tens of dollars, an installed hump a few thousand, and Wales’s entire national conversion cost about £32.5 million, less than two lane-miles of urban freeway. None of the cities above had a budget or a technology that others lack. They simply decided to start, and their streets changed within a term of office.
Conclusion#
On local residential streets, slowing traffic through traffic calming is a ridiculously lopsided trade. It is effective and cheap, with few downsides and large benefits beyond preventing crashes. It makes streets safer for everyone.
Cities should therefore treat a calm residential street as the default, not as an exception residents must win block by block. The question facing a city is not whether calming works, whether it can afford it, or whether it will take too long—Hoboken settled all three with paint and $40 plastic posts nine years ago. A city should have to justify why it keeps a residential street fast and dangerous; residents should not have to beg for safety outside their own front doors. Every day that street remains unchanged, the city chooses to leave the danger in place and makes residents carry the risk.
I posted this on Bluesky too, if you want to chime in.
For school routes and parent organizing, see Safe school streets.
References#
-
Aldred, R., Croft, J., and Goodman, A. (2019). “Impacts of an Active Travel Intervention with a Cycling Focus in a Suburban Context: One-Year Findings from an Evaluation of London’s In-Progress Mini-Hollands Programme.” Transportation Research Part A: Policy and Practice, 123, 147–169.
-
Aldred, R., and Goodman, A. (2020). “Low Traffic Neighbourhoods, Car Use, and Active Travel: Evidence from the People and Places Survey of Outer London Active Travel Interventions.” Findings.
-
Aldred, R., and Goodman, A. (2021). “The Impact of Low Traffic Neighbourhoods on Active Travel, Car Use, and Perceptions of Local Environment during the COVID-19 Pandemic.” Findings.
-
Atkins, AECOM, and Maher, M. (2018). 20 mph Research Study: Process and Impact Evaluation—Headline Report. UK Department for Transport.
-
Atkins, AECOM, and Maher, M. (2018). 20 mph Research Study: Technical Report. UK Department for Transport.
-
Batomen, B., Cloutier, M.-S., Carabali, M., Hagel, B., Howard, A., Rothman, L., Perreault, S., Brown, P., Di Ruggiero, E., and Bondy, S. (2024). “Traffic-Calming Measures and Road Traffic Collisions and Injuries: A Spatiotemporal Analysis.” American Journal of Epidemiology, 193(5), 707–717.
-
BikePortland (2020). “Report: City’s New 20 mph Signs Have Reduced Top-End Speeds.”
-
Brey, J. (2026). “This New England City Hasn’t Had a Traffic Death in Three Years.” Governing.
-
Bunn, F., Collier, T., Frost, C., Ker, K., Steinbach, R., Roberts, I., and Wentz, R. (2003). “Area-Wide Traffic Calming for Preventing Traffic-Related Injuries.” Cochrane Database of Systematic Reviews, (1), CD003110.
-
Cameron, M. H., and Elvik, R. (2010). “Nilsson’s Power Model connecting speed and road trauma: Applicability by road type and alternative models for urban roads.” Accident Analysis & Prevention, 42(6), 1908–1915.
-
City of Amsterdam (2025). 30 km/h in Amsterdam: Research Report.
-
City of Cambridge. “Cycling Safety Ordinance.”
-
City of Hoboken (2024). “City of Hoboken Reaches New Vision Zero Milestone: Seven Consecutive Years Without a Traffic Death.”
-
City of Hoboken (2026). “City of Hoboken Installs All-Way Stop Signs at 12 Intersections to Improve Safety for All Road Users.”
-
City of Jersey City (2024). Vision Zero Annual Report 2023.
-
Clean Air Action Group. “School Streets in Paris: Challenges of the Transformation.”
-
Dill, J., and McNeil, N. (2013). “Four Types of Cyclists? Examination of Typology for Better Understanding of Bicycling Behavior and Potential.” Transportation Research Record, 2387, 129–138.
-
DiMaggio, C., and Li, G. (2013). “Effectiveness of a Safe Routes to School Program in Preventing School-Aged Pedestrian Injury.” Pediatrics, 131(2), 290–296.
-
European Commission. “Brussels’ City 30: Changing Mobility Model for a Calmer City, Safe Roads and Less Noise.” EU Urban Mobility Observatory.
-
European Commission. “Time and Distance Halo Effects.” EU Road Safety.
-
Federal Highway Administration. (2009). Speed Concepts: Informational Guide. FHWA-SA-10-001.
-
Federal Highway Administration. (2015). Intersection Proven Safety Countermeasure: Technical Summary—Corridor Access Management. FHWA-SA-15-005.
-
Federal Highway Administration. (2017). “Traffic Calming ePrimer—Module 5: Effects of Traffic Calming Measures on Non-Personal Passenger Vehicles.”
-
Federal Highway Administration. (n.d.). “Noteworthy Speed Management Practices: Self-Enforcing Roadways—City of Golden, Colorado.”
-
Federal Highway Administration. (2024). “Roundabouts Help Deliver Safe System Approach for All Road Users.” EDC News.
-
Goodman, A., Laverty, A. A., Furlong, J., and Aldred, R. (2023). “The Impact of 2020 Low Traffic Neighbourhoods on Levels of Car/Van Driving among Residents: Findings from Lambeth, London, UK.” Findings.
-
Governors Highway Safety Association (2024). “Early 2024 U.S. Pedestrian Fatalities Up 48% From a Decade Ago.”
-
Grundy, C., Steinbach, R., Edwards, P., Green, J., Armstrong, B., and Wilkinson, P. (2009). “Effect of 20 mph traffic speed zones on road injuries in London, 1986–2006: Controlled interrupted time series analysis.” BMJ, 339, b4469.
-
Gyaase, D., Newton, S., Adams, C. A., Enuameh, Y., Adjei, B. N., and Nakua, E. K. (2023). “Effect of Speed Humps on Injury Consequences on Trunk Roads Traversing Towns in Ghana: A Quasi-Experimental Study.” Injury Prevention, 29(1), 68–73.
-
Hunter, R. F., Cleland, C. L., Busby, J., Nightingale, G., Kee, F., Williams, A. J., Kelly, P., Kelly, M. P., Milton, K., Kokka, K., and Jepson, R. (2023). “Investigating the Impact of a 20 Miles per Hour Speed Limit Intervention on Road Traffic Collisions, Casualties, Speed and Volume in Belfast, UK: Three-Year Follow-Up Outcomes of a Natural Experiment.” Journal of Epidemiology and Community Health, 77(1), 17–25.
-
Marqués, R., Hernández-Herrador, V., Calvo-Salazar, M., and García-Cebrián, J. A. (2015). “How Infrastructure Can Promote Cycling in Cities: Lessons from Seville.” Research in Transportation Economics, 53, 31–44.
-
Morrison, D. S., Thomson, H., and Petticrew, M. (2004). “Evaluation of the Health Effects of a Neighbourhood Traffic Calming Scheme.” Journal of Epidemiology and Community Health, 58(10), 837–840.
-
National Academies of Sciences, Engineering, and Medicine. (2023). Guide for Roundabouts. National Academies Press. NCHRP Research Report 1043.
-
New York City Department of Transportation (2024). “NYC DOT Completes Final Phase of Queens Boulevard Redesign.”
-
NICE Public Health Collaborating Centre—Physical Activity. (2006). Physical Activity and the Environment: Review One—Transport.
-
Oluwatomini, O., Eustace, D., Brewick, P., and Walsh, K. Q. (2026). “Modeling the Impacts of Physical Vertical Deflection Traffic Calming Measures on Speed, Traffic Volume, Noise, Emissions, and Delay: A Systematic Review.” ATS International Journal, LXVIII, 341–366.
-
Parker, M. R. (1997). Effects of Raising and Lowering Speed Limits on Selected Roadway Sections. FHWA-RD-97-002.
-
Pedestrian and Bicycle Information Center (2013). “Daylighting” (Hoboken, NJ case study).
-
Retting, R. A., Mandavilli, S., Russell, E. R., and McCartt, A. T. (2006). “Roundabouts, Traffic Flow and Public Opinion.” Traffic Engineering & Control.
-
Roaf, E., Larrington-Spencer, H., and Lawlor, E. R. (2024). “Interventions to Increase Active Travel: A Systematic Review.” Journal of Transport & Health, 38, 101860.
-
Rothman, L., Macpherson, A., Buliung, R., Macarthur, C., To, T., Larsen, K., and Howard, A. (2015). “Installation of Speed Humps and Pedestrian-Motor Vehicle Collisions in Toronto, Canada: A Quasi-Experimental Study.” BMC Public Health, 15, 774.
-
Russell, E. R., Mandavilli, S., and Rhys, M. J. (2005). Operational Performance of Kansas Roundabouts: Phase II. Kansas Department of Transportation, K-TRAN: KSU-02-4.
-
Senedd Research (2025). “What Impact Has 20mph Had on Road Safety in Wales?”
-
Sortiraparis (2020). “Rue de Rivoli Bikeway Is Now Permanent, Cars Banned.”
-
Streetsblog Massachusetts (2024). “New Somerville Safe Streets Ordinance Mandates 30-Mile Protected Bike Lane Network by 2030.”
-
Tefft, B. C. (2013). “Impact Speed and a Pedestrian’s Risk of Severe Injury or Death.” Accident Analysis & Prevention, 50, 871–878.
-
Tester, J. M., Rutherford, G. W., Wald, Z., and Rutherford, M. W. (2004). “A Matched Case-Control Study Evaluating the Effectiveness of Speed Humps in Reducing Child Pedestrian Injuries.” American Journal of Public Health, 94(4), 646–650.
-
Transport for London (2014). Centre Line Removal Trial.
-
Transport for Wales. (2025). Default 20 mph Speed Limit on Restricted Roads: National Monitoring Report.
-
Transport for Wales. (2025). “Vehicle Speed Monitoring Data: July 2023 to January 2025.”
-
Underhill, J. (n.d.). “Why Speed Limits Don’t Matter.” YouTube.
-
Underhill, J. (n.d.). “Get to Work Faster With Lower Speed Limits?” YouTube.
-
van Erpecum, C.-P. L., Bornioli, A., Cleland, C., Jones, S., Davis, A., den Braver, N. R., and Pilkington, P. (2024). “20 mph Speed Limits and Zones for Better Public Health: Meta-Narrative Evidence Synthesis.” Journal of Transport & Health, 39, 101917.
-
Wells, W. (2026). Post on feasibility, delay, and traffic safety. Bluesky.
-
Webster, D. C., and Mackie, A. M. (1996). Review of Traffic Calming Schemes in 20 mph Zones. TRL Report 215.
-
Xiao, C. S., Sinclair, N., Saunders, L., and Panter, J. (2023). “Evaluating the Impact of Low Traffic Neighbourhoods in Areas with Low Car Ownership: A Natural Experimental Evaluation.” Journal of Transport & Health, 33, 101658.
-
I use “Traffic calming” broadly here to include all infrastructure interventions that aim to lower the speed of cars. ↩
-
The exponents are fitted estimates, not physical law. Re-analyses find them lower on urban streets than on highways (Cameron and Elvik 2010). ↩
-
The common percentage scale shows the direction and numerical size of each study’s own estimate; it does not make the outcomes directly comparable. Cochrane, London, Toronto, Montreal, and New York City estimate changes in the frequency of crashes, casualties, collisions, or injuries. Oakland reports the adjusted odds that a child was injured as a pedestrian in relation to living near a speed hump, while Ghana reports the adjusted odds of a worse injury outcome among recorded crashes. A reduction in odds is not the same quantity as a reduction in incidence, and the rows should not be ranked as if they estimated one common effect. ↩