Safe streets are not a minority preference
2026-08-20 → 2026-10-05
Advocates for safer street designs such as Traffic calming are sometimes dismissed as a loud minority, implying that most people would oppose the change or consider it unimportant. I think this is deeply problematic.
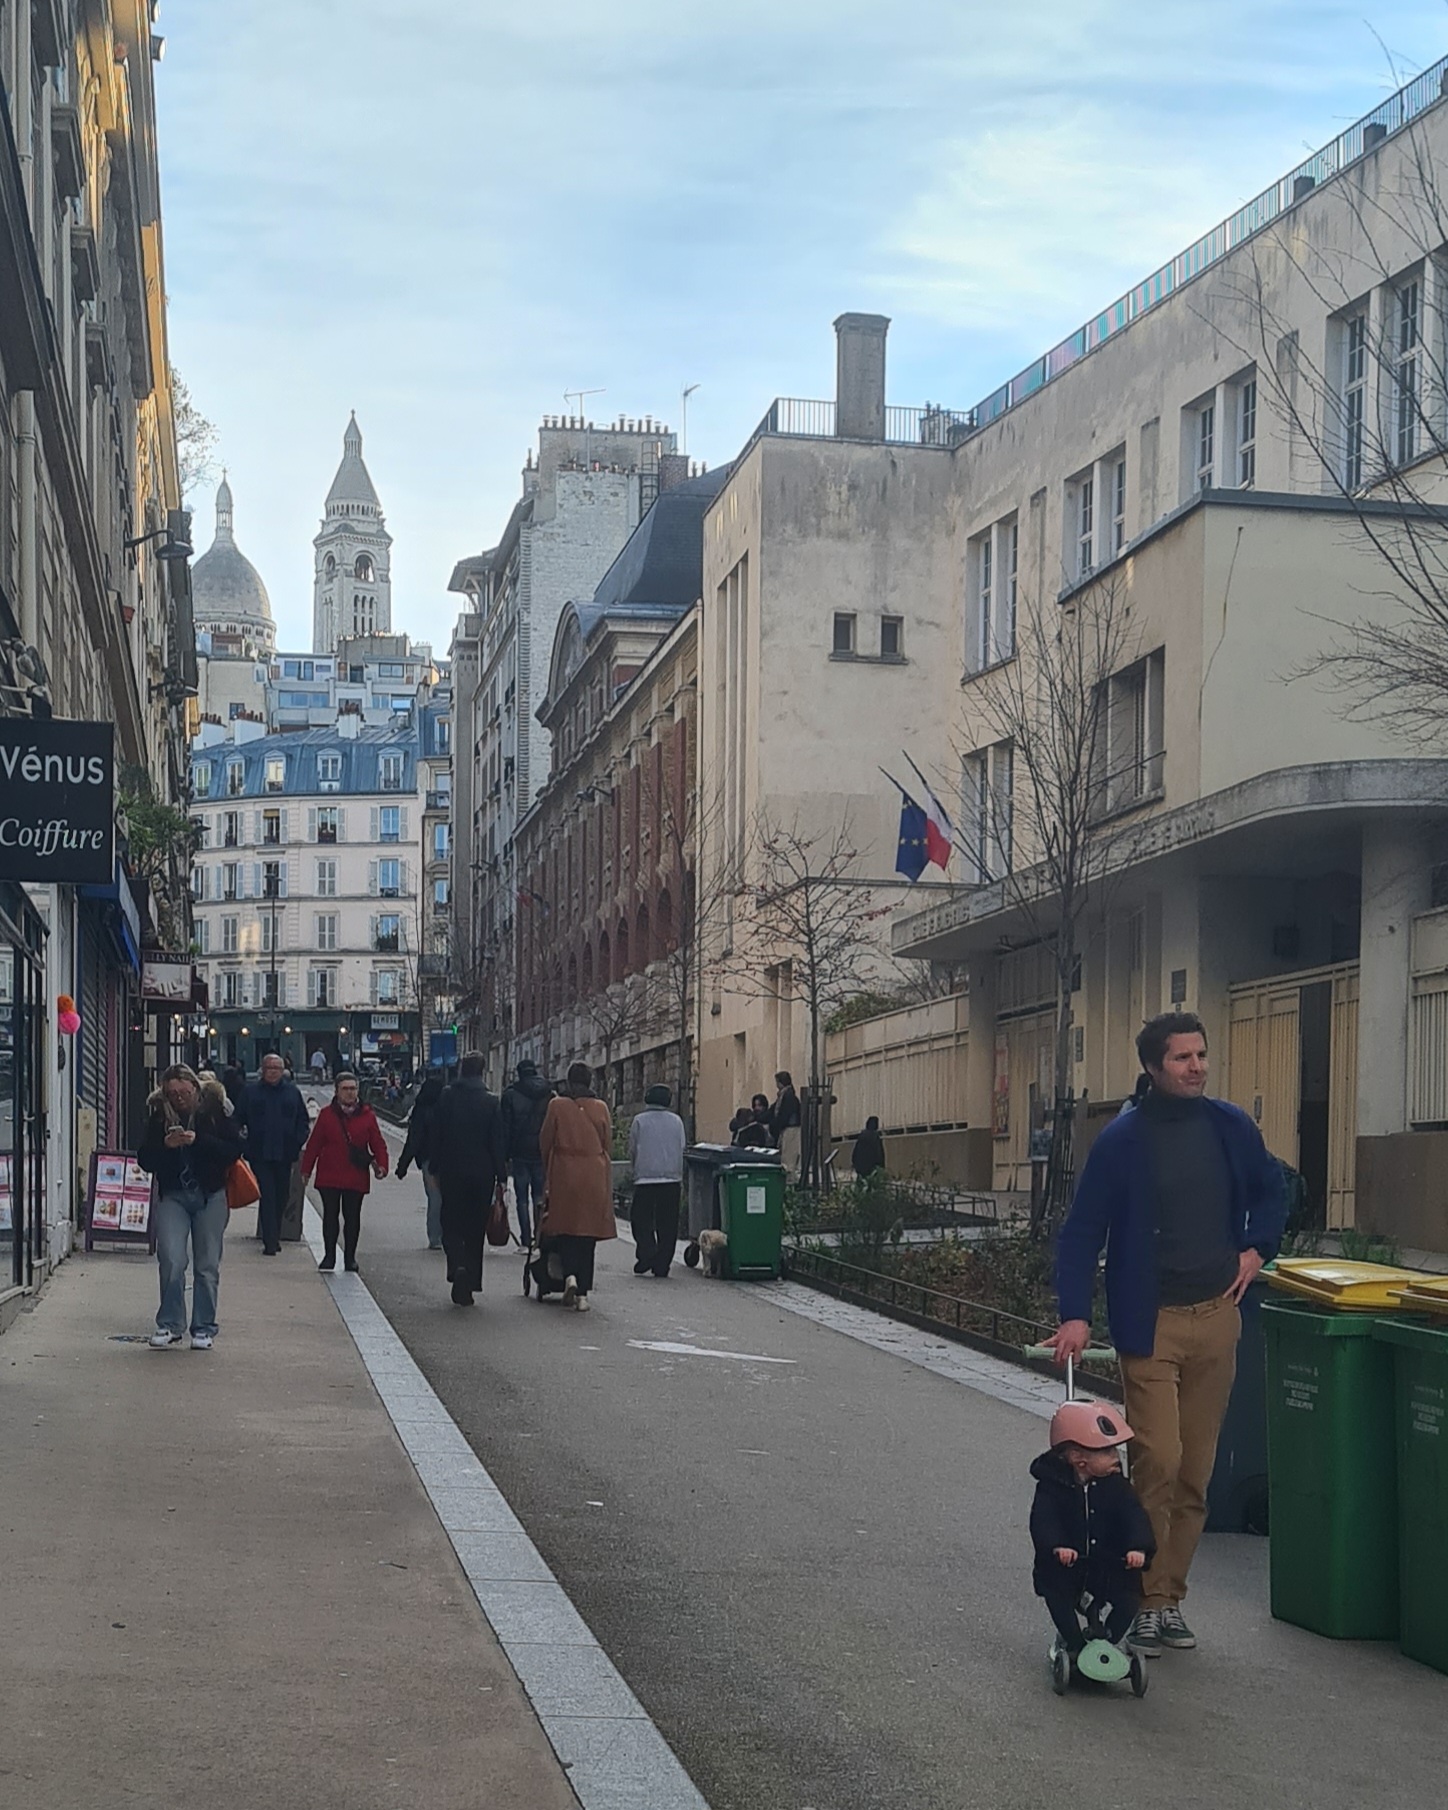
Rue Ferdinand-Flocon in Paris after its conversion into a planted “school street.” Photo: Guallendra, CC0.

Suppose the following question:
“On this school route, would you prefer the street without any traffic calming, or a calmer design that slows cars and makes walking and biking safer, with roughly 50% fewer children killed or seriously injured and generally modest effects on travel time?”
I doubt the answer would look like a minority preference.
(See Traffic calming works for detailed evidence)
Status quo bias—mode share is not a referendum#
Let’s start with the number that makes driving look like an overwhelming preference. In the 2024 American Community Survey, 69.2% of US workers drove alone and another 9.2% carpooled. 13.3% worked from home, so cars, trucks, and vans carried about 90% of workers who physically commuted. New York City is one conspicuous exception (2024 Citywide Mobility Survey) where sustainable mode outnumbers car. Does this mean Americans vastly prefer driving?
Not necessarily. The ACS records what workers did under the transportation and housing options available to them, not what they would choose from equally safe and convenient alternatives. Nor does the evidence suggest that people simply love commuting by car. An analysis of more than 22,000 US travel episodes found a modest negative association between trip duration and mood, especially for drivers; the authors conclude that “Long commutes significantly degrade the mood” of drivers and bus riders. A survey of 828 workers in Portland concluded that “people who bike and walk to work are happier with their commutes.” And in a 2026 survey of 2,000 adults in the fifty largest US metropolitan areas, nearly two-thirds said they would pay more to live in a walkable community, and a majority preferred a smaller lot in a walkable neighborhood over a larger homesite requiring more driving.
Two US surveys found that 56% of adults in the Portland region and 51% across the 50 largest metropolitan areas were “interested but concerned” about biking (Dill and McNeil 2013; Dill and McNeil 2016). Only 31% in Portland and 37% nationally were in the “No Way, No How” group. The rest, a clear majority, was at least open to biking. Given the status-quo bias, this is probably an underestimation of how likely people may choose sustainable modes when they are viable and safe. FHWA’s Bikeway Selection Guide therefore treats this group as the typical urban design user that the design should target.
Charlottesville’s own survey, though less rigorous, points the same way. In the 2021 Move2Health Equity Community Mobility Survey by the Piedmont Environmental Council and the Move2Health Equity Coalition, driving alone was respondents’ most frequent mode, yet 79% of the 428 respondents chose walking, biking, or transit as their preferred mode if barriers were removed. The most frequent barriers were the lack of sidewalks and bike lanes and infrequent transit.1
Not Just Bikes’ “I am not a Cyclist” makes a strong, general point: people tends to choose the mode that is most convenient and efficient. There are very few “cyclists cyclists”, people ride bikes when it’s a safe and efficient mode of transportation.
That is also how I think about my own trips. Although I usually ride an e-bike, I am not married to it. I drive, bike, walk, or ride the bus depending on which option works best. If a city has excellent transit, people tend to use it. If a city is an extremely car-dependent hell, people have to drive. Treating people as fixed “drivers” or “cyclists” mistakes a practical choice for an identity.
The dominance of driving also creates an empathy problem. Because most people experience most streets from inside a car, it is difficult—even with good intentions—to imagine what the same street feels like to a child crossing it, a parent pushing a stroller, or someone biking while a truck passes inches away. A driver can easily picture the inconvenience of a speed hump, a lane reduction, or a slower turn; the danger and stress experienced outside the car are largely invisible. Public opinion can therefore overweight small, familiar costs to driving while underweighting risks that most respondents rarely experience.
These studies do not prove that driving is a minority preference. But they do suggest that a silent majority might choose not to drive if reliable, safe alternatives existed. Because it is difficult to imagine a completely different built environment, the surveys may also underestimate potential mode change.
The current mode share is not a neutral measure of preference. A person choosing between driving where every infrastructure is built for driving and biking where infrastructure is hostile to them is not choosing between equally competitive options. When one mode is safe and convenient while the alternatives are dangerous, the resulting behavior is not one’s voluntary choice but an engineered one.
We need to raise the bar for safe streets for non-drivers#
The double standard is strong here. We don’t poll residents on whether pavement structure, drainage, grading, or guardrails should meet minimum engineering standards for motor vehicles. Those protections for cars are treated as minimal necessities. But when the subject is a safer crossing, a protected bike lane, or traffic calming, cities tend to poll residents, commission studies, and then use opposition as a reason to delay or weaken it. Safety for driving is treated as a must-do baseline; safety for walking and biking is treated as an optional amenity that must win a popularity contest.
Public input is important. It should help set priorities and resolve real tradeoffs. But it, especially when the vast majority of people cannot “see” the issues, should not determine the minimum safety bar for sustainable modes.
The federal Safe System approach considers death and serious injury unacceptable and calls for proactive design that anticipates human mistakes. FHWA’s Traffic Calming ePrimer documents 22 measures, and its Bikeway Selection Guide helps practitioners select facilities for different roadway conditions. NACTO’s design guidance provides more complete designs for safe urban streets and bikeways. Yet incorporating even simple treatments into streets in many US cities remains a constant struggle.
Bike infrastructure is also not a niche protection that benefits only people biking. A 13-year study of 12 large US cities, covering more than 17,000 fatalities and 77,000 severe injuries, found that better safety outcomes for all road users were associated with more bike facilities—especially protected and separated facilities—not simply with having more people biking. This result directly challenges the idea that bike infrastructure is solely for “cyclists” who constitute a very small minority of people. Well-designed, safe streets reduce the risk for everyone.
The benefits are too great to delay#
Safer streets create massive societal benefits. A connected, low-stress walking and biking network can:
- prevent deaths and serious injuries among people walking, biking, and driving (Traffic calming works);
- reduce the economic losses from dangerous streets—medical care, emergency response, lost productivity, property damage, and congestion (Traffic calming is cheap);
- give people practical alternatives to driving, because cars are space-inefficient and shifting trips to walking, biking, and transit reduces traffic (Traffic evaporation) and transportation emissions (EPA);
- make physical activity part of daily life and improve health;
- reduce the household cost of forced car ownership (Cost of car ownership);
- support the local economy: a review of 23 US and Canadian studies found a consensus of positive or neutral benefits of safe street infrastructure on nearby retail and food-service businesses, and I wrote why those findings can still apply to small cities; and
- help children breathe cleaner air, travel independently, and build physical activity into the trip to school.
The case of Charlottesville#
These are also Charlottesville’s adopted goals. The 2021 Comprehensive Plan calls for a connected network of safe and convenient walking, biking, and transit accommodations, safe walking and biking routes to every public school, and walkable, bikeable, transit-accessible neighborhoods. It explicitly ties walking and biking infrastructure to the city’s climate goals. The Climate Action Plan commits the city to cutting greenhouse gas emissions 45% below 2011 levels by 2030 and reaching carbon neutrality by 2050; its first transportation strategy is to increase travel by walking, biking, and transit through connected networks. Safe streets are therefore not a competing amenity. They are necessary to implement the city’s own transportation, land use, health, and climate commitments.
Traffic policy also shapes air pollution and physical activity. A prospective parallel cohort study of 3,414 children in London and Luton found that, during the four years after London’s Ultra Low Emission Zone took effect, residential nitrogen dioxide exposure fell faster in London and children’s lung function grew faster. London children had started with lower average lung function; after four years, they had caught up with the Luton comparison group. This natural experiment does not isolate the ULEZ from every concurrent difference, but it provides unusually direct evidence connecting a traffic emissions policy, cleaner air, and children’s lung development.
Walking or biking to school can also build physical activity into daily life. A systematic review of 68 studies found moderate-quality evidence that active school travelers were more physically active and that biking to school was associated with better cardiovascular fitness. One cross-sectional study of 1,700 Spanish adolescents found higher cognitive performance scores among girls who actively commuted, but not among boys. The broader evidence for learning is less clear: a systematic review and meta-analysis found no statistically significant overall association with cognitive performance or academic achievement. The health case is stronger than the learning claim.
The cost of the status quo: why only prioritizing maintenance can be bad#
Public Works and Traffic Engineering have both explained that limited staff capacity requires them to prioritize maintenance. But maintenance is not neutral. Repaving a dangerous street and restoring the same geometry preserves the danger, often until the next maintenance cycle. If all available capacity goes toward reproducing the existing network, a safer network, and its massive benefits, will remain perpetually next in line and never happen.
Also note that maintenance and improvement is not mutually exclusive. Maintenance projects are often the cheapest and fastest opportunity to improve safety. FHWA explicitly calls installing bicycle facilities during resurfacing an efficient and cost-effective way to build connected networks, using tools such as lane narrowing, road diets, roadway reconfiguration, parking changes, and new striping. FHWA reported that a four-to-three-lane road diet with bike lanes cost about $36,000 per mile when bundled with resurfacing, compared with $100,000 as a standalone project. These opportunities are time-sensitive: once a street is repaved and the old markings are restored, the low-cost window closes.
So why do so few resurfaced streets come back calmer and safer? The 2021 Comprehensive Plan says the city should continue including bicycle, pedestrian, accessibility, and transit improvements in all major road projects, including paving; Rose Hill Drive shows that the city can use scheduled repaving to reconsider striping and safety. Yet the city’s current public process appears to separate pavement maintenance from new traffic-infrastructure changes, and I could not find a published rule requiring every resurfacing project to undergo a Complete Streets or traffic-calming redesign. Does every street in the paving plan undergo such a redesign before its old geometry is restored? If not, why not? Safer striping, daylighting, crossings, and speed management should be the default scope of routine road work, not separate projects residents must repeatedly request.
Some improvements do require dedicated staff, engineering, and capital. That is not a reason to defer them indefinitely; it is evidence that current capacity is inadequate. If maintaining unsafe designs consumes all available capacity, the city must add capacity or change how maintenance is scoped. Otherwise, “prioritizing maintenance” becomes a policy of making today’s danger permanent.
Charlottesville recorded 16 traffic deaths and 2,409 injuries from 2019–2025, according to the annual Virginia Traffic Crash Facts reports. Crashes in 2024 alone produced an estimated $23–$30 million in economic losses.
Meanwhile, Hoboken has gone nine consecutive years without a traffic death. That comparison does not identify the effect of any single treatment, but it shows that Charlottesville’s outcomes are not inevitable.
Name the constraint, then fix it#
The central question is straightforward: what specifically prevents Charlottesville from applying these well-established solutions? Is the constraint staff capacity, funding, law, engineering, or something else? What would be required to overcome it?
If the constraint is staff capacity or funding, the city should make the case for the resources it needs. I raised the same problem when the bicycle-infrastructure budget was slated to fall to $100,000 per year: inability to execute is a capacity problem to fix, not a justification for inaction. Is the department asking Council for the necessary resources? If so, residents can help advocate for them. If not, why not?
-
The survey was online only and spread mainly through neighborhood groups, and its authors call it “by no means definitive”: respondents were older, whiter, and more educated than the city as a whole. So it is one local data point, not a representative sample, but it is consistent with the national surveys. ↩